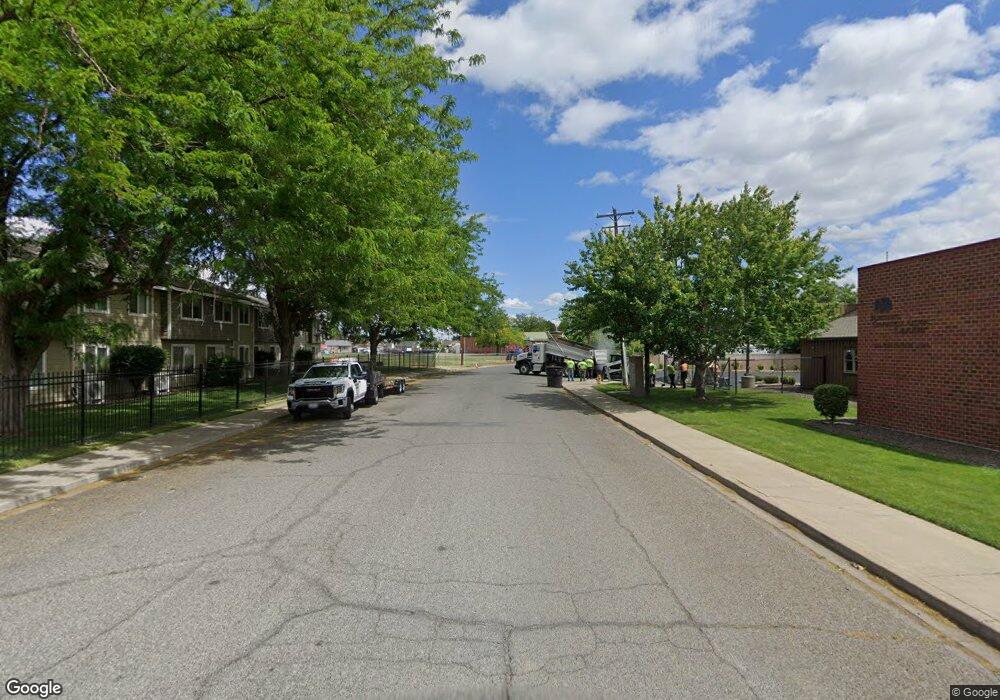
9 S C St Toppenish, WA 98948
Estimated Value: $231,703 - $248,000
3
Beds
1
Bath
1,012
Sq Ft
$241/Sq Ft
Est. Value
About This Home
This home is located at 9 S C St, Toppenish, WA 98948 and is currently estimated at $243,426, approximately $240 per square foot. 9 S C St is a home located in Yakima County with nearby schools including Toppenish High School.
Ownership History
Date
Name
Owned For
Owner Type
Purchase Details
Closed on
Nov 1, 2002
Sold by
Martinez Maurilio and Martinez Guadalupe Ochoa D
Bought by
Robledo Jaime and Robledo Sandra
Current Estimated Value
Home Financials for this Owner
Home Financials are based on the most recent Mortgage that was taken out on this home.
Original Mortgage
$73,720
Outstanding Balance
$30,810
Interest Rate
5.99%
Estimated Equity
$212,616
Purchase Details
Closed on
Jun 26, 2002
Sold by
Martinez Ochoa Leticia
Bought by
Martinez Maurilio and Martinez Guadalupe Ochoa D
Home Financials for this Owner
Home Financials are based on the most recent Mortgage that was taken out on this home.
Original Mortgage
$41,438
Interest Rate
6.86%
Create a Home Valuation Report for This Property
The Home Valuation Report is an in-depth analysis detailing your home's value as well as a comparison with similar homes in the area
Home Values in the Area
Average Home Value in this Area
Purchase History
| Date | Buyer | Sale Price | Title Company |
|---|---|---|---|
| Robledo Jaime | $76,000 | Schreiner Title Company | |
| Martinez Maurilio | -- | Schreiner Title Company |
Source: Public Records
Mortgage History
| Date | Status | Borrower | Loan Amount |
|---|---|---|---|
| Open | Robledo Jaime | $73,720 | |
| Previous Owner | Martinez Maurilio | $41,438 |
Source: Public Records
Tax History Compared to Growth
Tax History
| Year | Tax Paid | Tax Assessment Tax Assessment Total Assessment is a certain percentage of the fair market value that is determined by local assessors to be the total taxable value of land and additions on the property. | Land | Improvement |
|---|---|---|---|---|
| 2025 | $1,541 | $179,900 | $33,900 | $146,000 |
| 2023 | $1,790 | $121,400 | $33,700 | $87,700 |
| 2022 | $1,261 | $111,900 | $33,400 | $78,500 |
| 2021 | $2,131 | $101,100 | $30,000 | $71,100 |
| 2019 | $980 | $84,000 | $27,100 | $56,900 |
| 2018 | $794 | $67,600 | $26,000 | $41,600 |
| 2017 | $711 | $67,900 | $26,000 | $41,900 |
| 2016 | $715 | $67,850 | $25,950 | $41,900 |
| 2015 | $715 | $65,250 | $25,950 | $39,300 |
| 2014 | $715 | $65,850 | $25,950 | $39,900 |
| 2013 | $715 | $65,850 | $25,950 | $39,900 |
Source: Public Records
Map
Nearby Homes