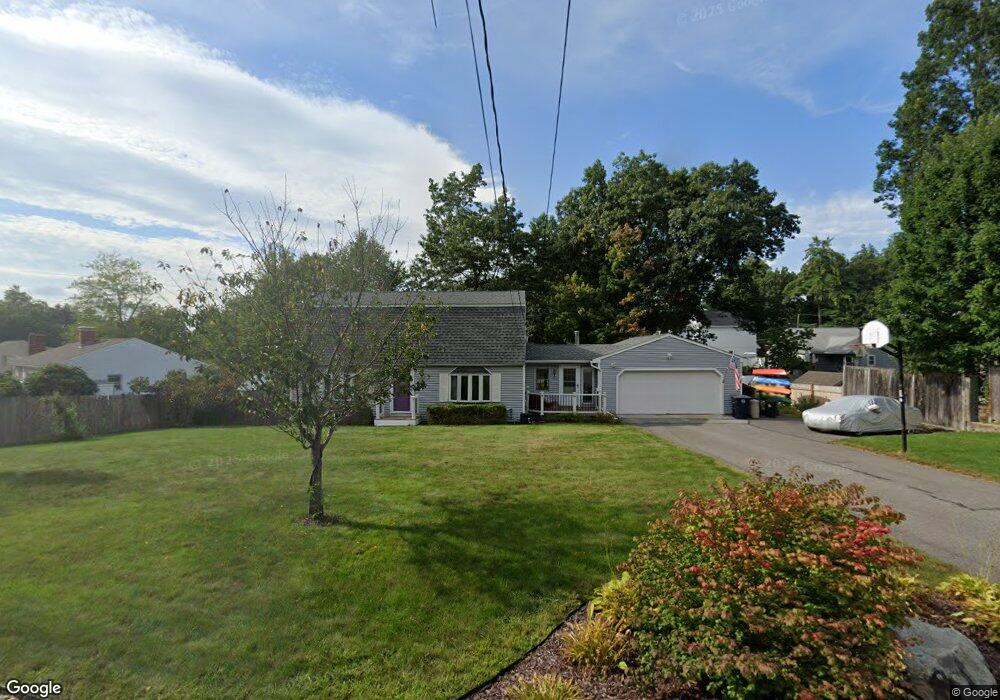
9 Sagamore Rd Nashua, NH 03062
Southwest Nashua NeighborhoodEstimated Value: $585,000 - $605,000
4
Beds
2
Baths
1,940
Sq Ft
$305/Sq Ft
Est. Value
About This Home
This home is located at 9 Sagamore Rd, Nashua, NH 03062 and is currently estimated at $592,626, approximately $305 per square foot. 9 Sagamore Rd is a home located in Hillsborough County with nearby schools including Main Dunstable School, Elm Street Middle School, and Nashua High School South.
Ownership History
Date
Name
Owned For
Owner Type
Purchase Details
Closed on
Jun 6, 2005
Sold by
Chunn Steven and Chunn Leslie A
Bought by
Lefebvre Robert A and Lefebvre Martha T
Current Estimated Value
Home Financials for this Owner
Home Financials are based on the most recent Mortgage that was taken out on this home.
Original Mortgage
$333,000
Outstanding Balance
$173,517
Interest Rate
5.83%
Mortgage Type
Purchase Money Mortgage
Estimated Equity
$419,109
Purchase Details
Closed on
Apr 28, 1997
Sold by
Ouellette John D and Ouellette Judith A
Bought by
Kenney Steven B and Kenney Michelle E
Home Financials for this Owner
Home Financials are based on the most recent Mortgage that was taken out on this home.
Original Mortgage
$115,900
Interest Rate
7.77%
Mortgage Type
Purchase Money Mortgage
Create a Home Valuation Report for This Property
The Home Valuation Report is an in-depth analysis detailing your home's value as well as a comparison with similar homes in the area
Home Values in the Area
Average Home Value in this Area
Purchase History
| Date | Buyer | Sale Price | Title Company |
|---|---|---|---|
| Lefebvre Robert A | $585,000 | -- | |
| Kenney Steven B | $116,000 | -- | |
| Lefebvre Robert A | $585,000 | -- |
Source: Public Records
Mortgage History
| Date | Status | Borrower | Loan Amount |
|---|---|---|---|
| Open | Kenney Steven B | $333,000 | |
| Closed | Kenney Steven B | $333,000 | |
| Previous Owner | Kenney Steven B | $115,900 |
Source: Public Records
Tax History Compared to Growth
Tax History
| Year | Tax Paid | Tax Assessment Tax Assessment Total Assessment is a certain percentage of the fair market value that is determined by local assessors to be the total taxable value of land and additions on the property. | Land | Improvement |
|---|---|---|---|---|
| 2024 | $7,538 | $474,100 | $167,200 | $306,900 |
| 2023 | $7,246 | $397,500 | $133,800 | $263,700 |
| 2022 | $7,183 | $397,500 | $133,800 | $263,700 |
| 2021 | $6,420 | $276,500 | $89,200 | $187,300 |
| 2020 | $6,166 | $272,700 | $89,200 | $183,500 |
| 2019 | $5,934 | $272,700 | $89,200 | $183,500 |
| 2018 | $5,784 | $272,700 | $89,200 | $183,500 |
| 2017 | $5,666 | $219,700 | $69,200 | $150,500 |
| 2016 | $5,508 | $219,700 | $69,200 | $150,500 |
| 2015 | $5,389 | $219,700 | $69,200 | $150,500 |
| 2014 | $5,226 | $217,300 | $69,200 | $148,100 |
Source: Public Records
Map
Nearby Homes
- 375 Main Dunstable Rd
- 2 Rene Dr
- 5 Wilderness Dr
- 188 Harris Rd
- 15 Westray Dr
- 22 Newburgh Rd
- 25 Cortez Dr Unit U57
- 4 Henry David Dr Unit 203
- 16 Laurel Ct Unit U320
- 23 Glen Dr
- 31 Tenby Dr
- 33 Cannon Dr
- 28 Nottingham Dr
- 47 Dogwood Dr Unit U202
- 29 Greenwood Dr
- 57 Wethersfield Rd
- 12 Spring Cove Rd Unit U103
- 40 Spring Cove Rd Unit U117
- 8 Althea Ln Unit U26
- 247 Main Dunstable Rd