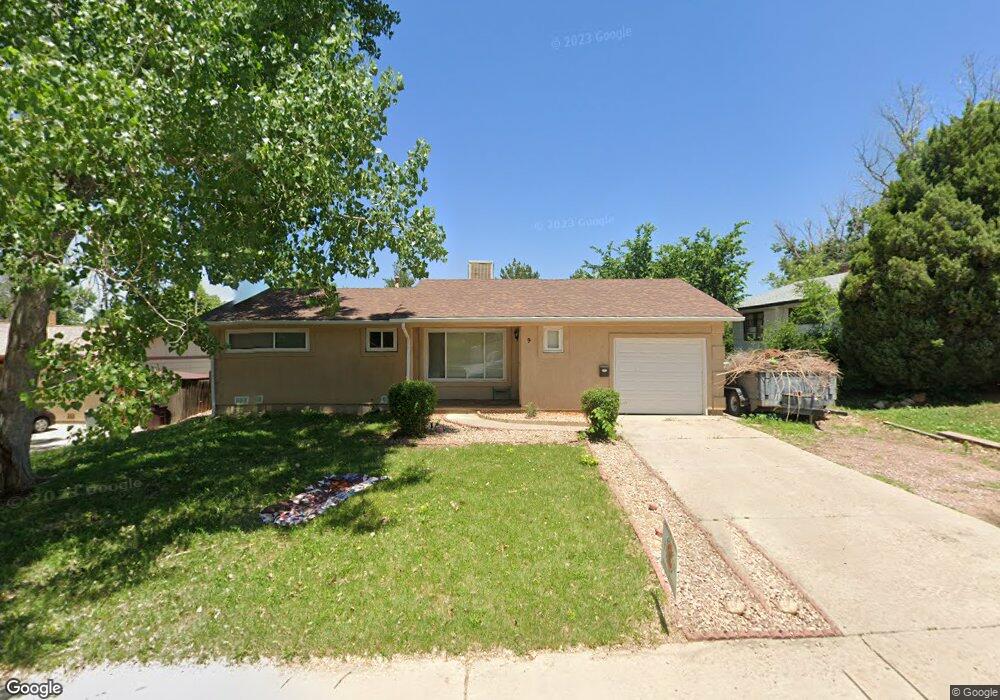
9 Scotland Rd Pueblo, CO 81001
Belmont NeighborhoodEstimated Value: $215,857 - $232,000
3
Beds
1
Bath
962
Sq Ft
$232/Sq Ft
Est. Value
About This Home
This home is located at 9 Scotland Rd, Pueblo, CO 81001 and is currently estimated at $223,214, approximately $232 per square foot. 9 Scotland Rd is a home located in Pueblo County with nearby schools including Belmont Elementary School, Heaton Middle School, and East High School.
Ownership History
Date
Name
Owned For
Owner Type
Purchase Details
Closed on
Dec 8, 2008
Sold by
Banham Robert W and Ellsworth Anna M
Bought by
Banham Robert W
Current Estimated Value
Purchase Details
Closed on
Mar 24, 1998
Sold by
Rodriquez R A R and Rodriquez Marshall S
Bought by
Bamham R W R and Bamham Ellsworth A
Purchase Details
Closed on
Apr 28, 1994
Sold by
Evers Curtis A + Geralyn M
Bought by
Rodriquez R A R and Rodriquez Marshall S
Purchase Details
Closed on
Jan 5, 1993
Sold by
Gutierrez Loretta A
Bought by
Evers Curtis A + Geralyn M
Purchase Details
Closed on
May 17, 1988
Sold by
Holladay Gerald N
Bought by
Gutierrez Loretta A
Purchase Details
Closed on
Dec 16, 1985
Sold by
Holladay Gerald N + Dorothy W
Bought by
Holladay Gerald N
Purchase Details
Closed on
Dec 3, 1985
Sold by
Holladay Gerald M + Dorothy W
Bought by
Holladay Gerald N + Dorothy W
Purchase Details
Closed on
May 9, 1985
Sold by
Ewing
Bought by
Holladay Gerald M + Dorothy W
Purchase Details
Closed on
Jun 7, 1972
Sold by
Ewing Irvin L + Helen L
Bought by
Ewing
Create a Home Valuation Report for This Property
The Home Valuation Report is an in-depth analysis detailing your home's value as well as a comparison with similar homes in the area
Home Values in the Area
Average Home Value in this Area
Purchase History
| Date | Buyer | Sale Price | Title Company |
|---|---|---|---|
| Banham Robert W | $38,000 | None Available | |
| Bamham R W R | $81,000 | -- | |
| Rodriquez R A R | $61,000 | -- | |
| Evers Curtis A + Geralyn M | $48,500 | -- | |
| Gutierrez Loretta A | $42,500 | -- | |
| Holladay Gerald N | $25,900 | -- | |
| Holladay Gerald N + Dorothy W | -- | -- | |
| Holladay Gerald M + Dorothy W | $42,000 | -- | |
| Ewing | -- | -- |
Source: Public Records
Tax History Compared to Growth
Tax History
| Year | Tax Paid | Tax Assessment Tax Assessment Total Assessment is a certain percentage of the fair market value that is determined by local assessors to be the total taxable value of land and additions on the property. | Land | Improvement |
|---|---|---|---|---|
| 2024 | $857 | $8,710 | -- | -- |
| 2023 | $867 | $12,400 | $1,340 | $11,060 |
| 2022 | $910 | $9,170 | $1,390 | $7,780 |
| 2021 | $939 | $9,430 | $1,430 | $8,000 |
| 2020 | $771 | $9,430 | $1,430 | $8,000 |
| 2019 | $772 | $7,642 | $751 | $6,891 |
| 2018 | $573 | $6,320 | $756 | $5,564 |
| 2017 | $578 | $6,320 | $756 | $5,564 |
| 2016 | $557 | $6,132 | $836 | $5,296 |
| 2015 | $278 | $6,132 | $836 | $5,296 |
| 2014 | $271 | $5,976 | $836 | $5,140 |
Source: Public Records
Map
Nearby Homes
- 36 Scotland Rd
- 1706 Comanche Rd
- 1814 Lark Bunting Ln
- 2 Hilton Ln
- 5 Douglas Ln
- 2 Alan Shepard Rd Unit 8
- 1827 Seminole Ln
- 1701 Jerry Murphy Rd
- 39 Apollo Ln
- 55 Bonnymede Rd Unit S
- 55 Bonnymede Rd
- 55 Bonnymede Rd Unit K
- 1909 Mohawk Rd
- 11 Macnaughton Rd
- 1925 Mohawk Rd
- 130 Scotland Rd Unit D
- 172 Bonnymede Rd Unit C
- 6 Pineridge Ct
- 18 Dundee Ln
- 136 Douglas Ln