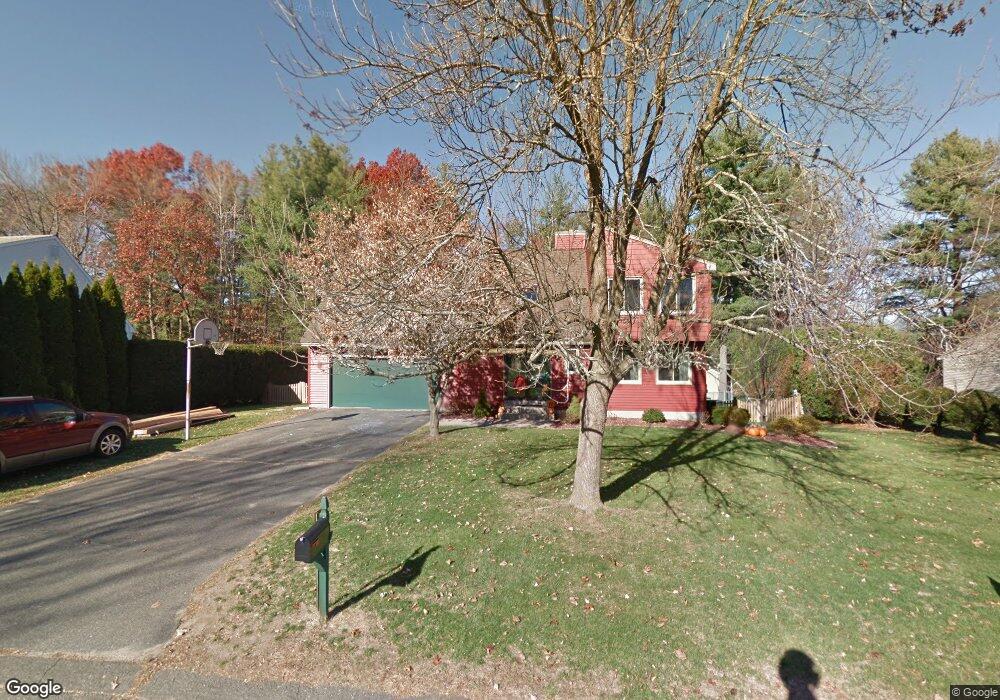
9 Silver Ln Easthampton, MA 01027
Estimated Value: $561,000 - $635,000
4
Beds
3
Baths
2,200
Sq Ft
$268/Sq Ft
Est. Value
About This Home
This home is located at 9 Silver Ln, Easthampton, MA 01027 and is currently estimated at $590,550, approximately $268 per square foot. 9 Silver Ln is a home located in Hampshire County with nearby schools including Easthampton High School, Calvary Baptist Christian School, and Tri-County Schools.
Ownership History
Date
Name
Owned For
Owner Type
Purchase Details
Closed on
Nov 24, 2009
Sold by
Yarrows Jeffrey R and Yarrows Erin M
Bought by
Clark Michael J and Clark Kelly L
Current Estimated Value
Home Financials for this Owner
Home Financials are based on the most recent Mortgage that was taken out on this home.
Original Mortgage
$201,500
Outstanding Balance
$131,160
Interest Rate
4.86%
Mortgage Type
Purchase Money Mortgage
Estimated Equity
$459,390
Purchase Details
Closed on
May 29, 2002
Sold by
Laprade Denis A and Laprade Kathleen M
Bought by
Yarrows Erin M and Yarrows Jeffrey R
Home Financials for this Owner
Home Financials are based on the most recent Mortgage that was taken out on this home.
Original Mortgage
$176,800
Interest Rate
7%
Mortgage Type
Purchase Money Mortgage
Purchase Details
Closed on
Nov 1, 1989
Sold by
Wagda Kurt E
Bought by
Laprade Denis A
Create a Home Valuation Report for This Property
The Home Valuation Report is an in-depth analysis detailing your home's value as well as a comparison with similar homes in the area
Home Values in the Area
Average Home Value in this Area
Purchase History
| Date | Buyer | Sale Price | Title Company |
|---|---|---|---|
| Clark Michael J | $311,500 | -- | |
| Yarrows Erin M | $221,000 | -- | |
| Laprade Denis A | $165,000 | -- |
Source: Public Records
Mortgage History
| Date | Status | Borrower | Loan Amount |
|---|---|---|---|
| Open | Clark Michael J | $201,500 | |
| Previous Owner | Laprade Denis A | $176,800 | |
| Previous Owner | Laprade Denis A | $97,667 | |
| Previous Owner | Laprade Denis A | $116,000 |
Source: Public Records
Tax History
| Year | Tax Paid | Tax Assessment Tax Assessment Total Assessment is a certain percentage of the fair market value that is determined by local assessors to be the total taxable value of land and additions on the property. | Land | Improvement |
|---|---|---|---|---|
| 2025 | $6,631 | $485,100 | $121,300 | $363,800 |
| 2024 | $6,446 | $475,400 | $117,800 | $357,600 |
| 2023 | $4,817 | $328,800 | $93,100 | $235,700 |
| 2022 | $5,435 | $328,800 | $93,100 | $235,700 |
| 2021 | $5,990 | $341,500 | $93,100 | $248,400 |
| 2020 | $5,839 | $328,800 | $93,100 | $235,700 |
| 2019 | $4,848 | $313,600 | $93,100 | $220,500 |
| 2018 | $4,690 | $293,100 | $87,900 | $205,200 |
| 2017 | $4,573 | $282,100 | $84,500 | $197,600 |
| 2016 | $4,401 | $282,300 | $84,500 | $197,800 |
| 2015 | $4,277 | $282,300 | $84,500 | $197,800 |
Source: Public Records
Map
Nearby Homes
Your Personal Tour Guide
Ask me questions while you tour the home.