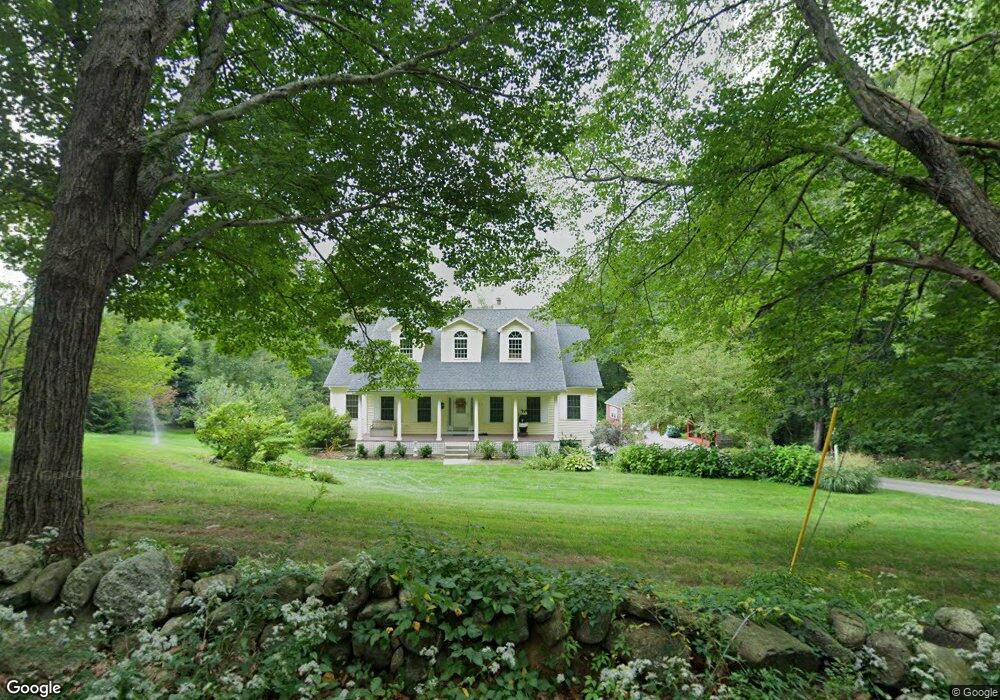
9 South Rd Sturbridge, MA 01566
Estimated Value: $587,000 - $621,000
3
Beds
3
Baths
2,016
Sq Ft
$301/Sq Ft
Est. Value
About This Home
This home is located at 9 South Rd, Sturbridge, MA 01566 and is currently estimated at $607,102, approximately $301 per square foot. 9 South Rd is a home located in Worcester County with nearby schools including Burgess Elementary School, Tantasqua Regional Junior High School, and Tantasqua Regional High School.
Ownership History
Date
Name
Owned For
Owner Type
Purchase Details
Closed on
Jun 27, 2025
Sold by
Socha Philip and Socha Christine
Bought by
Socha Ft and Socha
Current Estimated Value
Purchase Details
Closed on
May 14, 2004
Sold by
Mogavero Ruth D
Bought by
Socha Christine and Socha Philip
Purchase Details
Closed on
Sep 10, 2002
Sold by
Mogavero Ruth D
Bought by
Gem Resident Real Est
Create a Home Valuation Report for This Property
The Home Valuation Report is an in-depth analysis detailing your home's value as well as a comparison with similar homes in the area
Home Values in the Area
Average Home Value in this Area
Purchase History
| Date | Buyer | Sale Price | Title Company |
|---|---|---|---|
| Socha Ft | -- | -- | |
| Socha Ft | -- | -- | |
| Socha Christine | $105,000 | -- | |
| Socha Christine | $105,000 | -- | |
| Gem Resident Real Est | $100,000 | -- | |
| Gem Resident Real Est | $100,000 | -- |
Source: Public Records
Mortgage History
| Date | Status | Borrower | Loan Amount |
|---|---|---|---|
| Previous Owner | Gem Resident Real Est | $300,000 |
Source: Public Records
Tax History Compared to Growth
Tax History
| Year | Tax Paid | Tax Assessment Tax Assessment Total Assessment is a certain percentage of the fair market value that is determined by local assessors to be the total taxable value of land and additions on the property. | Land | Improvement |
|---|---|---|---|---|
| 2025 | $9,631 | $604,600 | $86,600 | $518,000 |
| 2024 | $9,200 | $557,900 | $84,900 | $473,000 |
| 2023 | $8,663 | $479,400 | $74,000 | $405,400 |
| 2022 | $8,330 | $435,000 | $67,000 | $368,000 |
| 2021 | $7,792 | $409,700 | $64,000 | $345,700 |
| 2020 | $7,792 | $409,700 | $64,000 | $345,700 |
| 2019 | $7,377 | $385,200 | $65,700 | $319,500 |
| 2018 | $7,090 | $364,700 | $62,600 | $302,100 |
| 2017 | $6,751 | $348,000 | $60,500 | $287,500 |
| 2016 | $6,601 | $343,600 | $58,700 | $284,900 |
| 2015 | $6,497 | $337,700 | $58,700 | $279,000 |
Source: Public Records
Map
Nearby Homes