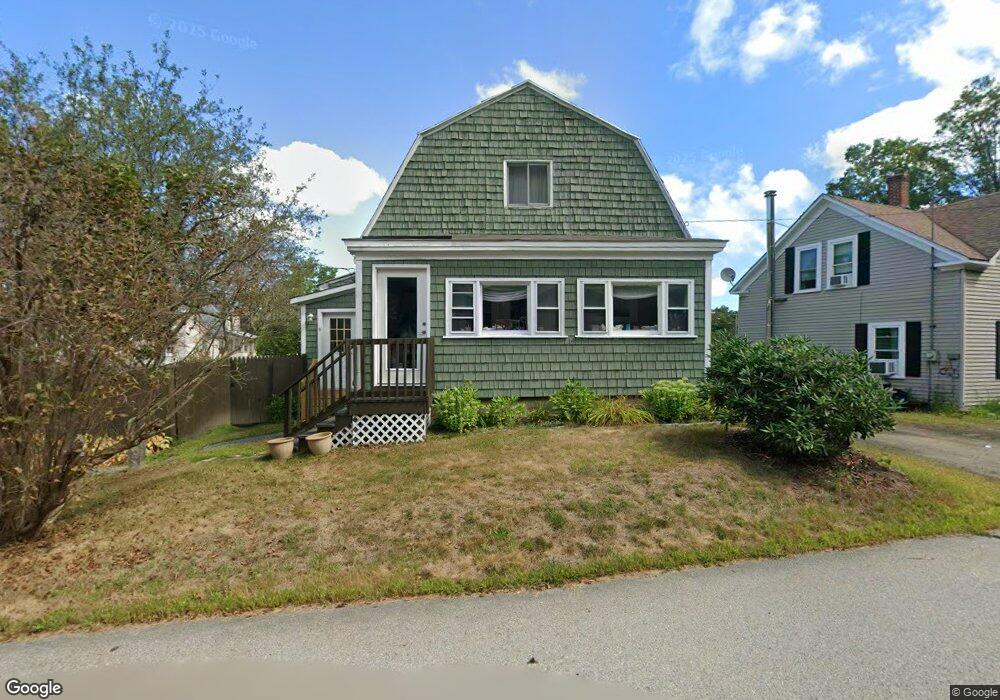
9 Spruce St Jaffrey, NH 03452
Estimated Value: $333,308 - $352,000
3
Beds
2
Baths
1,747
Sq Ft
$198/Sq Ft
Est. Value
About This Home
This home is located at 9 Spruce St, Jaffrey, NH 03452 and is currently estimated at $346,327, approximately $198 per square foot. 9 Spruce St is a home located in Cheshire County with nearby schools including Jaffrey Grade School, Conant Middle High School, and Conant High School.
Ownership History
Date
Name
Owned For
Owner Type
Purchase Details
Closed on
Apr 27, 2009
Sold by
Rameau Leonard W and Rameau Michele E
Bought by
Desmarais Seth M and Desmarais April M
Current Estimated Value
Home Financials for this Owner
Home Financials are based on the most recent Mortgage that was taken out on this home.
Original Mortgage
$147,283
Outstanding Balance
$93,457
Interest Rate
4.93%
Mortgage Type
Purchase Money Mortgage
Estimated Equity
$252,870
Purchase Details
Closed on
Jun 10, 2008
Sold by
Gordon Mitchell P
Bought by
Hsbc Bank Usa
Create a Home Valuation Report for This Property
The Home Valuation Report is an in-depth analysis detailing your home's value as well as a comparison with similar homes in the area
Home Values in the Area
Average Home Value in this Area
Purchase History
| Date | Buyer | Sale Price | Title Company |
|---|---|---|---|
| Desmarais Seth M | $150,000 | -- | |
| Hsbc Bank Usa | $117,300 | -- |
Source: Public Records
Mortgage History
| Date | Status | Borrower | Loan Amount |
|---|---|---|---|
| Open | Hsbc Bank Usa | $147,283 |
Source: Public Records
Tax History Compared to Growth
Tax History
| Year | Tax Paid | Tax Assessment Tax Assessment Total Assessment is a certain percentage of the fair market value that is determined by local assessors to be the total taxable value of land and additions on the property. | Land | Improvement |
|---|---|---|---|---|
| 2024 | $5,264 | $160,500 | $25,500 | $135,000 |
| 2023 | $5,353 | $160,500 | $25,500 | $135,000 |
| 2022 | $4,972 | $160,500 | $25,500 | $135,000 |
| 2021 | $4,476 | $160,500 | $25,500 | $135,000 |
| 2020 | $4,419 | $160,500 | $25,500 | $135,000 |
| 2019 | $4,504 | $129,300 | $20,400 | $108,900 |
| 2018 | $4,267 | $129,300 | $20,400 | $108,900 |
| 2017 | $4,263 | $129,300 | $20,400 | $108,900 |
| 2016 | $4,267 | $129,300 | $20,400 | $108,900 |
| 2015 | $4,295 | $129,300 | $20,400 | $108,900 |
| 2014 | $4,442 | $150,818 | $38,152 | $112,666 |
| 2013 | $4,389 | $150,818 | $38,152 | $112,666 |
Source: Public Records
Map
Nearby Homes
- 8 Cross St
- 40 Charlonne St
- 75 Main St
- 11 Saint Jean St
- 14 Windy Fields Ln
- 94 Fitch Rd
- 33 Summit Dr
- 161 Scenic Dr
- 29 Andrews Dr
- 98 Perry Rd
- 121 Overview Dr
- 13 Harkness Rd
- 199 Bryant Rd
- 18 Roberts Dr Unit 1
- 65 Roberts Dr Unit 17
- 57 Roberts Dr Unit 19
- 446 Squantum Rd
- 520 North St
- 52 Roberts Dr Unit 5
- 40 Roberts Dr Unit 3