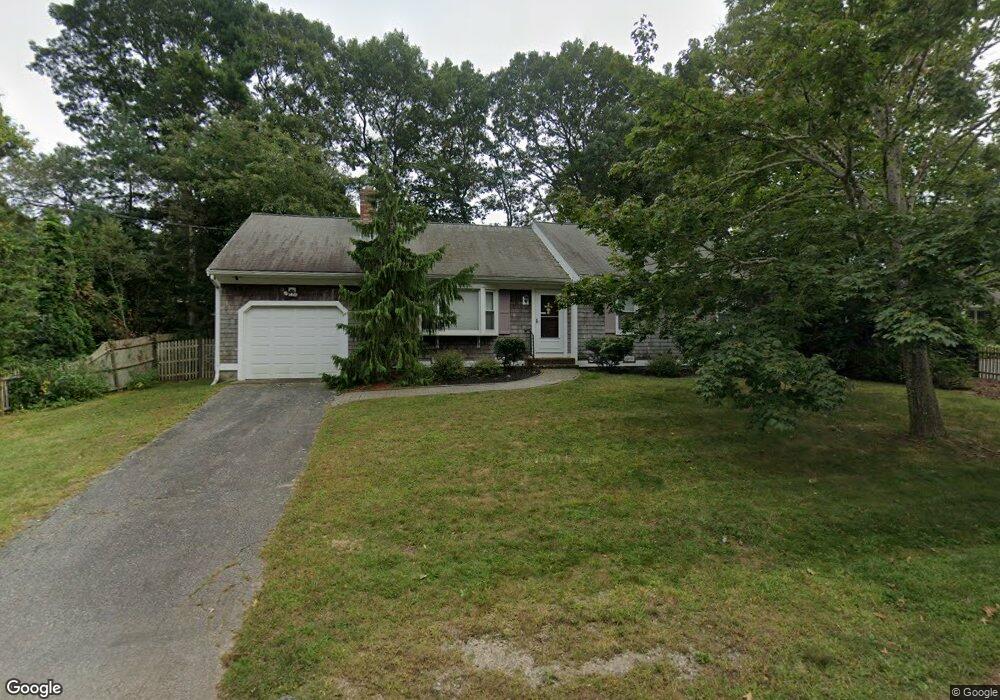
9 Starboard Dr East Falmouth, MA 2536
Estimated Value: $873,790
3
Beds
2
Baths
1,201
Sq Ft
$728/Sq Ft
Est. Value
About This Home
This home is located at 9 Starboard Dr, East Falmouth, MA 2536 and is currently estimated at $873,790, approximately $727 per square foot. 9 Starboard Dr is a home located in Barnstable County with nearby schools including Teaticket Elementary School, Morse Pond School, and Lawrence School.
Ownership History
Date
Name
Owned For
Owner Type
Purchase Details
Closed on
Jan 10, 2000
Sold by
Lombard Michael E and Lombard Patricia A
Bought by
Poor Sisters Of Jesus
Current Estimated Value
Purchase Details
Closed on
Jul 31, 1998
Sold by
Leary Irene E Est and Smith
Bought by
Lombard Michael E and Lombard Patricia A
Home Financials for this Owner
Home Financials are based on the most recent Mortgage that was taken out on this home.
Original Mortgage
$68,500
Interest Rate
6.92%
Mortgage Type
Purchase Money Mortgage
Purchase Details
Closed on
Jun 29, 1990
Sold by
Owens George A
Bought by
Learey Irene M
Home Financials for this Owner
Home Financials are based on the most recent Mortgage that was taken out on this home.
Original Mortgage
$85,000
Interest Rate
10.27%
Mortgage Type
Purchase Money Mortgage
Create a Home Valuation Report for This Property
The Home Valuation Report is an in-depth analysis detailing your home's value as well as a comparison with similar homes in the area
Home Values in the Area
Average Home Value in this Area
Purchase History
| Date | Buyer | Sale Price | Title Company |
|---|---|---|---|
| Poor Sisters Of Jesus | $205,000 | -- | |
| Poor Sisters Of Jesus | $205,000 | -- | |
| Lombard Michael E | $137,000 | -- | |
| Lombard Michael E | $137,000 | -- | |
| Learey Irene M | $140,000 | -- |
Source: Public Records
Mortgage History
| Date | Status | Borrower | Loan Amount |
|---|---|---|---|
| Previous Owner | Learey Irene M | $68,500 | |
| Previous Owner | Learey Irene M | $85,000 |
Source: Public Records
Tax History Compared to Growth
Tax History
| Year | Tax Paid | Tax Assessment Tax Assessment Total Assessment is a certain percentage of the fair market value that is determined by local assessors to be the total taxable value of land and additions on the property. | Land | Improvement |
|---|---|---|---|---|
| 2025 | -- | $609,200 | $296,500 | $312,700 |
| 2024 | -- | $541,800 | $258,100 | $283,700 |
| 2023 | $0 | $450,900 | $206,500 | $244,400 |
| 2022 | $0 | $410,800 | $193,100 | $217,700 |
| 2021 | $0 | $388,300 | $193,100 | $195,200 |
| 2020 | $0 | $370,700 | $175,500 | $195,200 |
| 2019 | $0 | $360,300 | $175,500 | $184,800 |
| 2018 | $0 | $349,800 | $175,500 | $174,300 |
| 2017 | $0 | $343,700 | $175,500 | $168,200 |
| 2016 | -- | $343,700 | $175,500 | $168,200 |
| 2015 | -- | $343,700 | $175,500 | $168,200 |
| 2014 | -- | $343,100 | $175,600 | $167,500 |
Source: Public Records
Map
Nearby Homes