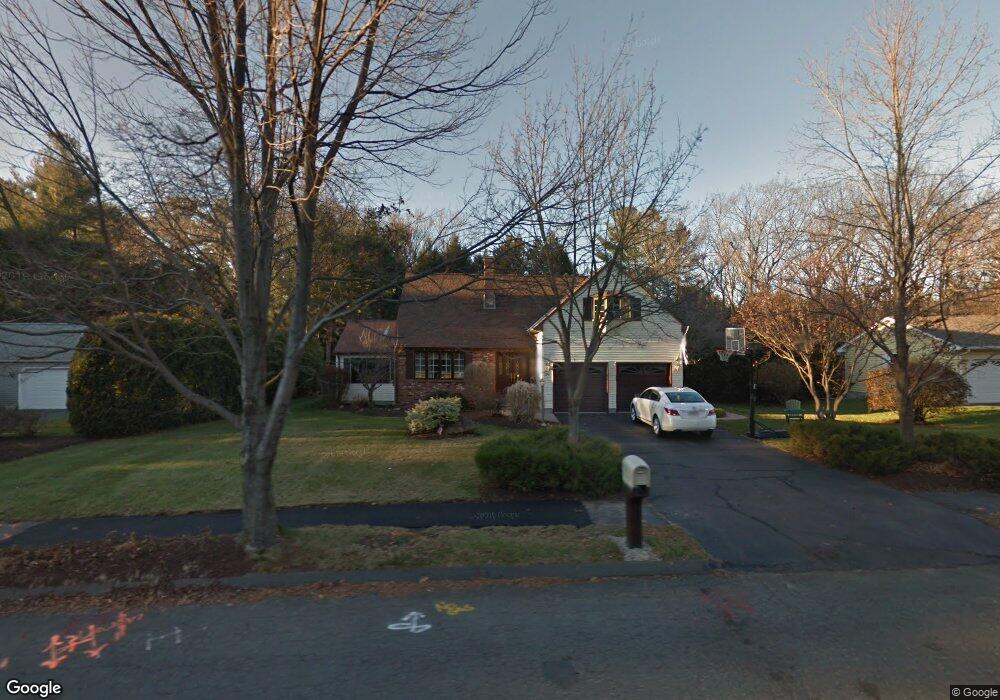
9 Sterling Dr Easthampton, MA 01027
Estimated Value: $573,000 - $705,000
4
Beds
3
Baths
2,590
Sq Ft
$240/Sq Ft
Est. Value
About This Home
This home is located at 9 Sterling Dr, Easthampton, MA 01027 and is currently estimated at $622,794, approximately $240 per square foot. 9 Sterling Dr is a home located in Hampshire County with nearby schools including Easthampton High School, Calvary Baptist Christian School, and Tri-County Schools.
Ownership History
Date
Name
Owned For
Owner Type
Purchase Details
Closed on
Mar 22, 2004
Sold by
Rogers Ann Marie and Rogers Leroy F
Bought by
Rogers Kathryn M and Downie Kristen L
Current Estimated Value
Purchase Details
Closed on
Mar 19, 2004
Sold by
Rogers Ann Marie and Rogers Leroy F
Bought by
Rogers Kathryn M and Downie Kristen L
Create a Home Valuation Report for This Property
The Home Valuation Report is an in-depth analysis detailing your home's value as well as a comparison with similar homes in the area
Home Values in the Area
Average Home Value in this Area
Purchase History
| Date | Buyer | Sale Price | Title Company |
|---|---|---|---|
| Rogers Kathryn M | -- | -- | |
| Rogers Kathryn M | -- | -- |
Source: Public Records
Mortgage History
| Date | Status | Borrower | Loan Amount |
|---|---|---|---|
| Open | Rogers Kathryn M | $135,000 | |
| Previous Owner | Rogers Kathryn M | $139,000 |
Source: Public Records
Tax History
| Year | Tax Paid | Tax Assessment Tax Assessment Total Assessment is a certain percentage of the fair market value that is determined by local assessors to be the total taxable value of land and additions on the property. | Land | Improvement |
|---|---|---|---|---|
| 2025 | $7,517 | $549,900 | $128,100 | $421,800 |
| 2024 | $7,329 | $540,500 | $124,200 | $416,300 |
| 2023 | $5,457 | $372,500 | $98,500 | $274,000 |
| 2022 | $6,157 | $372,500 | $98,500 | $274,000 |
| 2021 | $6,816 | $388,600 | $98,500 | $290,100 |
| 2020 | $6,616 | $372,500 | $98,500 | $274,000 |
| 2019 | $5,423 | $350,800 | $98,500 | $252,300 |
| 2018 | $5,270 | $329,400 | $92,800 | $236,600 |
| 2017 | $5,155 | $318,000 | $89,300 | $228,700 |
| 2016 | $5,079 | $325,800 | $89,300 | $236,500 |
| 2015 | $4,936 | $325,800 | $89,300 | $236,500 |
Source: Public Records
Map
Nearby Homes
Your Personal Tour Guide
Ask me questions while you tour the home.