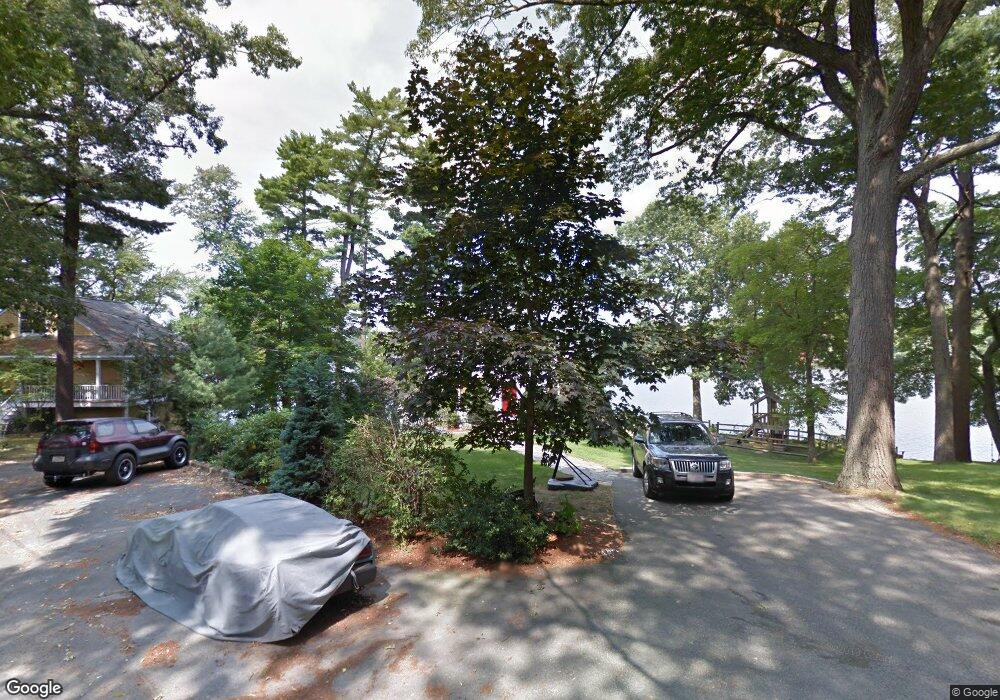
9 Summer Ave Lynnfield, MA 01940
Estimated Value: $961,444 - $1,099,000
3
Beds
3
Baths
2,233
Sq Ft
$468/Sq Ft
Est. Value
About This Home
This home is located at 9 Summer Ave, Lynnfield, MA 01940 and is currently estimated at $1,044,111, approximately $467 per square foot. 9 Summer Ave is a home located in Essex County with nearby schools including Lynnfield Middle School, Lynnfield High School, and Our Lady Of Assumption School.
Ownership History
Date
Name
Owned For
Owner Type
Purchase Details
Closed on
Jun 21, 2010
Sold by
Rosenwald Mitchell and Rosenwald Cenia Peters
Bought by
Peters Cenia
Current Estimated Value
Purchase Details
Closed on
Apr 9, 2004
Sold by
Firicano Debra J and Firicano Frank C
Bought by
Rosenwald Mitchell
Purchase Details
Closed on
Apr 3, 2001
Sold by
Thomas John J and Thomas Tracey E
Bought by
Firicano Frank C and Firicano Debra J
Purchase Details
Closed on
Oct 15, 1987
Sold by
Piazza Steven
Bought by
Glennon Arthur W
Create a Home Valuation Report for This Property
The Home Valuation Report is an in-depth analysis detailing your home's value as well as a comparison with similar homes in the area
Home Values in the Area
Average Home Value in this Area
Purchase History
| Date | Buyer | Sale Price | Title Company |
|---|---|---|---|
| Peters Cenia | -- | -- | |
| Rosenwald Mitchell | $545,000 | -- | |
| Firicano Frank C | $380,000 | -- | |
| Glennon Arthur W | $182,500 | -- |
Source: Public Records
Mortgage History
| Date | Status | Borrower | Loan Amount |
|---|---|---|---|
| Open | Glennon Arthur W | $288,900 | |
| Closed | Glennon Arthur W | $288,500 |
Source: Public Records
Tax History
| Year | Tax Paid | Tax Assessment Tax Assessment Total Assessment is a certain percentage of the fair market value that is determined by local assessors to be the total taxable value of land and additions on the property. | Land | Improvement |
|---|---|---|---|---|
| 2025 | $9,607 | $909,800 | $519,900 | $389,900 |
| 2024 | $8,489 | $807,700 | $460,100 | $347,600 |
| 2023 | $8,405 | $743,800 | $436,500 | $307,300 |
| 2022 | $8,404 | $700,900 | $436,500 | $264,400 |
| 2021 | $8,344 | $628,800 | $374,700 | $254,100 |
| 2020 | $8,065 | $579,400 | $323,700 | $255,700 |
| 2019 | $7,858 | $564,900 | $309,200 | $255,700 |
| 2018 | $7,773 | $564,900 | $309,200 | $255,700 |
| 2017 | $7,784 | $564,900 | $309,200 | $255,700 |
| 2016 | $7,494 | $516,800 | $276,400 | $240,400 |
| 2015 | $7,488 | $516,800 | $276,400 | $240,400 |
Source: Public Records
Map
Nearby Homes
Your Personal Tour Guide
Ask me questions while you tour the home.