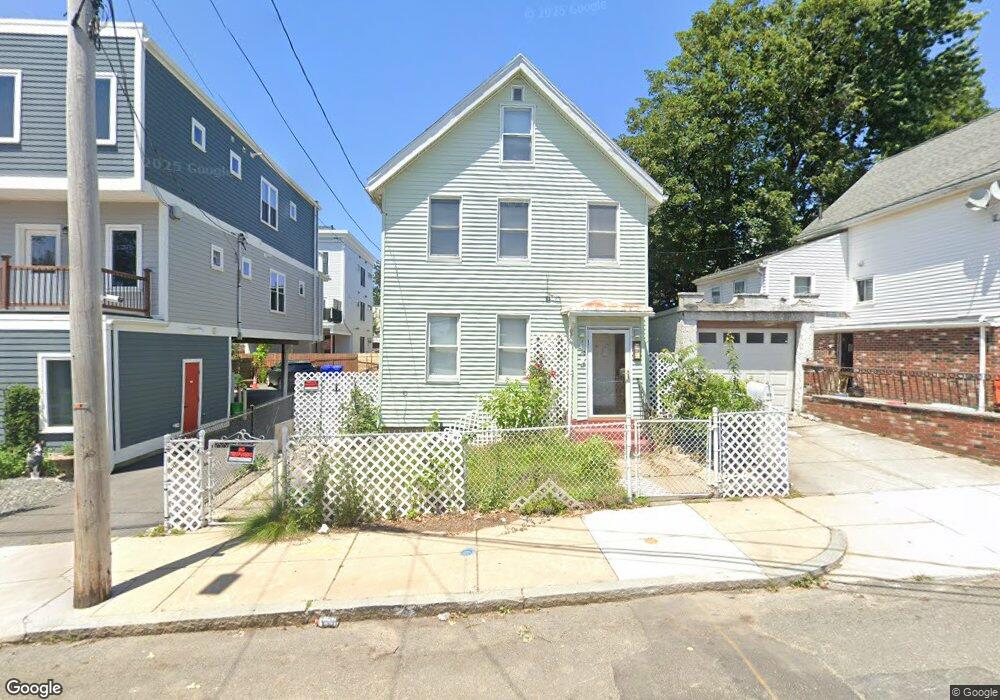
9 Swift Terrace Boston, MA 02128
Harbor View-Orient Heights NeighborhoodEstimated Value: $636,000 - $727,726
4
Beds
2
Baths
1,612
Sq Ft
$426/Sq Ft
Est. Value
About This Home
This home is located at 9 Swift Terrace, Boston, MA 02128 and is currently estimated at $687,182, approximately $426 per square foot. 9 Swift Terrace is a home located in Suffolk County with nearby schools including Excel Academy East Boston, Brooke Charter Schools East Boston, and East Boston Montessori School.
Ownership History
Date
Name
Owned For
Owner Type
Purchase Details
Closed on
Oct 4, 2024
Sold by
Sharpe Emmett Llc
Bought by
Lank David A
Current Estimated Value
Purchase Details
Closed on
Oct 3, 2024
Sold by
Lank David A
Bought by
Sharpe Emmett Llc
Purchase Details
Closed on
Mar 15, 2024
Sold by
Lank Evan and Lank David
Bought by
Sharpe Emmett Llc
Purchase Details
Closed on
Jul 25, 2023
Sold by
Emmett Ft and Emmett
Bought by
Lank David and Lank Evan
Home Financials for this Owner
Home Financials are based on the most recent Mortgage that was taken out on this home.
Original Mortgage
$228,750
Interest Rate
6.69%
Mortgage Type
Purchase Money Mortgage
Purchase Details
Closed on
Nov 20, 2019
Sold by
Emmett Francis D
Bought by
Emmett Ft
Create a Home Valuation Report for This Property
The Home Valuation Report is an in-depth analysis detailing your home's value as well as a comparison with similar homes in the area
Home Values in the Area
Average Home Value in this Area
Purchase History
| Date | Buyer | Sale Price | Title Company |
|---|---|---|---|
| Lank David A | -- | None Available | |
| Lank David A | -- | None Available | |
| Sharpe Emmett Llc | $262,500 | None Available | |
| Sharpe Emmett Llc | -- | None Available | |
| Sharpe Emmett Llc | -- | None Available | |
| Lank David | $305,000 | None Available | |
| Lank David | $305,000 | None Available | |
| Emmett Ft | -- | None Available | |
| Emmett Francis D | -- | None Available |
Source: Public Records
Mortgage History
| Date | Status | Borrower | Loan Amount |
|---|---|---|---|
| Previous Owner | Lank David | $228,750 |
Source: Public Records
Tax History Compared to Growth
Tax History
| Year | Tax Paid | Tax Assessment Tax Assessment Total Assessment is a certain percentage of the fair market value that is determined by local assessors to be the total taxable value of land and additions on the property. | Land | Improvement |
|---|---|---|---|---|
| 2025 | $7,183 | $620,300 | $180,300 | $440,000 |
| 2024 | $5,903 | $541,600 | $182,600 | $359,000 |
| 2023 | $5,487 | $510,900 | $172,200 | $338,700 |
| 2022 | $5,054 | $464,500 | $156,600 | $307,900 |
| 2021 | $4,676 | $438,200 | $147,700 | $290,500 |
| 2020 | $4,021 | $380,800 | $136,600 | $244,200 |
| 2019 | $3,580 | $339,700 | $106,200 | $233,500 |
| 2018 | $3,390 | $323,500 | $106,200 | $217,300 |
| 2017 | $3,325 | $314,000 | $106,200 | $207,800 |
| 2016 | $3,258 | $296,200 | $106,200 | $190,000 |
| 2015 | $3,007 | $248,300 | $95,000 | $153,300 |
| 2014 | $2,813 | $223,600 | $95,000 | $128,600 |
Source: Public Records
Map
Nearby Homes
- 426 Rear Saratoga St Unit R
- 512 Bennington St
- 655 Saratoga St Unit 201
- 528 Bennington St
- 106 Moore St Unit PH7
- 106 Moore St Unit 8
- 580 Bennington St Unit 580
- 398 Bremen St Unit 2
- 305R Lexington St
- 316 Princeton St Unit 2
- 7 Wordsworth St Unit 1-101
- 421 Saratoga St Unit 4A
- 421 Saratoga St Unit 1
- 421 Saratoga St Unit 3
- 98 Prescott St Unit 1
- 98 Prescott St Unit 3B
- 98 Prescott St Unit 2
- 31 Wordsworth St
- 278 Princeton St Unit 2
- 10 Wordsworth St
- 15 Swift Terrace Unit 1
- 15 Swift Terrace Unit 3
- 15 Swift Terrace
- 5 Swift Terrace
- 443 Frankfort St
- 19 Swift Terrace
- 447 Frankfort St Unit 1A
- 447 Frankfort St Unit 3A
- 447 Frankfort St Unit 2A
- 447 Frankfort St Unit 1
- 447 Frankfort St Unit 2
- 447 Frankfort St
- 447 Frankfort St
- 447 Frankfort St Unit 3
- 1 Swift Terrace
- 441 Frankfort St
- 441 Frankfort St Unit 1
- 449 Frankfort St
- 435 Frankfort St
- 6 Swift Terrace