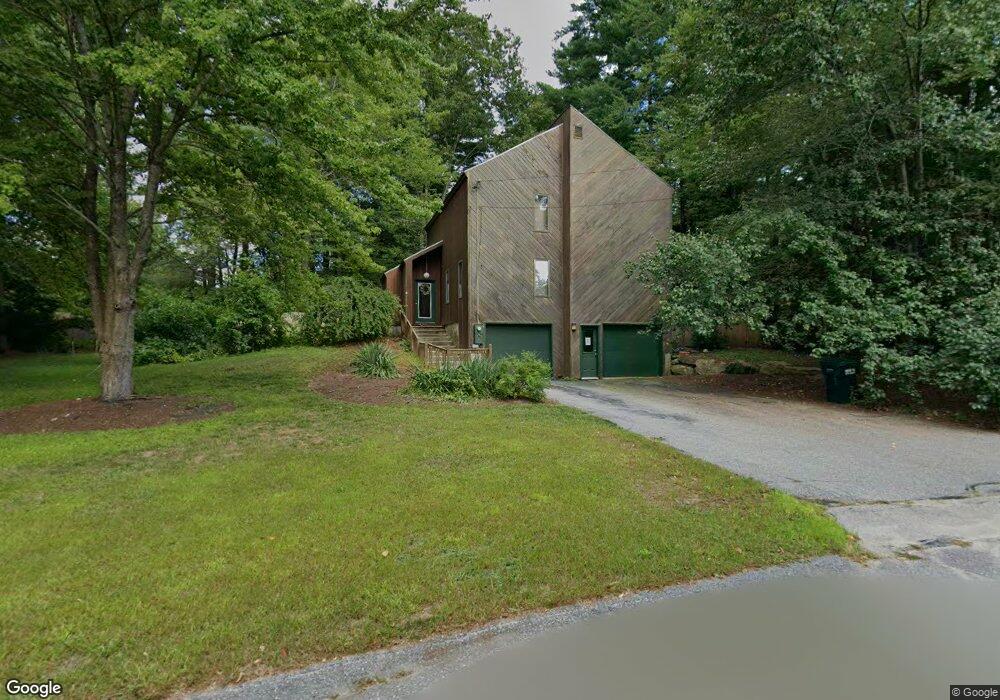
9 Sycamore Rd Milford, NH 03055
Estimated Value: $520,349 - $580,000
3
Beds
3
Baths
2,028
Sq Ft
$269/Sq Ft
Est. Value
About This Home
This home is located at 9 Sycamore Rd, Milford, NH 03055 and is currently estimated at $545,837, approximately $269 per square foot. 9 Sycamore Rd is a home with nearby schools including Jacques Memorial Elementary School, Heron Pond Elementary School, and Milford Middle School.
Ownership History
Date
Name
Owned For
Owner Type
Purchase Details
Closed on
Aug 31, 2021
Sold by
Pritchard David J and Pritchard Debra M
Bought by
Mckivergan Bryan and Mckee Courtney
Current Estimated Value
Home Financials for this Owner
Home Financials are based on the most recent Mortgage that was taken out on this home.
Original Mortgage
$280,000
Outstanding Balance
$254,779
Interest Rate
2.8%
Mortgage Type
Purchase Money Mortgage
Estimated Equity
$291,058
Purchase Details
Closed on
Jul 2, 1996
Sold by
Hardy Gordon E and Hardy Paula R
Bought by
Pritchard David J and Pritchard Debra M
Home Financials for this Owner
Home Financials are based on the most recent Mortgage that was taken out on this home.
Original Mortgage
$118,800
Interest Rate
8.05%
Create a Home Valuation Report for This Property
The Home Valuation Report is an in-depth analysis detailing your home's value as well as a comparison with similar homes in the area
Home Values in the Area
Average Home Value in this Area
Purchase History
| Date | Buyer | Sale Price | Title Company |
|---|---|---|---|
| Mckivergan Bryan | $350,000 | None Available | |
| Pritchard David J | $132,000 | -- |
Source: Public Records
Mortgage History
| Date | Status | Borrower | Loan Amount |
|---|---|---|---|
| Open | Mckivergan Bryan | $280,000 | |
| Previous Owner | Pritchard David J | $119,200 | |
| Previous Owner | Pritchard David J | $140,258 | |
| Previous Owner | Pritchard David J | $37,000 | |
| Previous Owner | Pritchard David J | $118,800 |
Source: Public Records
Tax History Compared to Growth
Tax History
| Year | Tax Paid | Tax Assessment Tax Assessment Total Assessment is a certain percentage of the fair market value that is determined by local assessors to be the total taxable value of land and additions on the property. | Land | Improvement |
|---|---|---|---|---|
| 2024 | $8,074 | $341,100 | $92,900 | $248,200 |
| 2023 | $7,562 | $341,100 | $92,900 | $248,200 |
| 2022 | $7,091 | $341,100 | $92,900 | $248,200 |
| 2021 | $6,873 | $341,100 | $92,900 | $248,200 |
| 2020 | $7,570 | $298,400 | $65,700 | $232,700 |
| 2019 | $7,749 | $298,400 | $65,700 | $232,700 |
| 2018 | $6,632 | $226,900 | $65,000 | $161,900 |
| 2017 | $6,669 | $226,900 | $65,000 | $161,900 |
| 2016 | $6,571 | $226,900 | $65,000 | $161,900 |
| 2015 | $6,575 | $230,200 | $65,000 | $165,200 |
| 2014 | $6,284 | $230,200 | $65,000 | $165,200 |
| 2013 | $6,208 | $230,200 | $65,000 | $165,200 |
Source: Public Records
Map
Nearby Homes
- 32 Larch Rd
- 0 Briar Cliff Dr
- 344 Elm St Unit 14
- 344 Elm St Unit 16
- 43 Boxwood Cir
- 24 Spaulding St
- 229 Mont Vernon Rd
- 44 Osgood Rd
- 57 Patch Hill Ln
- 51 Singer Brook Rd
- 26 Melendy Rd Unit 97
- 26 Melendy Rd Unit 42
- 11 Souhegan St
- 294 Mason Rd
- 40 North St
- 377 Nashua St
- 0 Claude Rd
- 7 Miles Rd
- 415 Savage Rd
- F-88-7 Aria Hill Dr