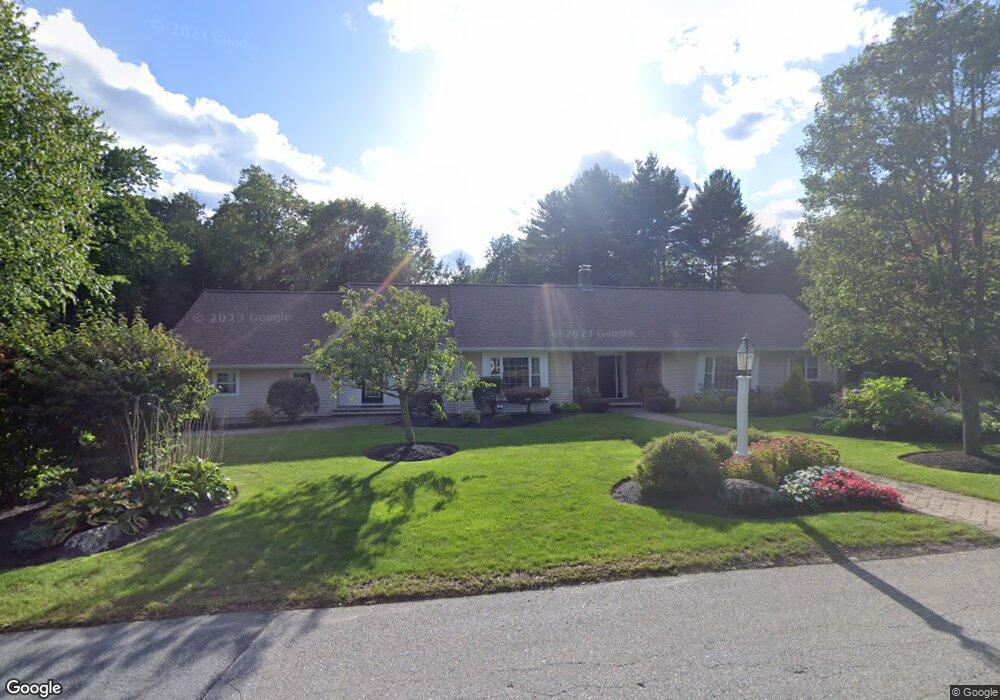
9 Timothy Dr Andover, MA 01810
Southern Andover NeighborhoodEstimated Value: $1,622,000 - $1,882,000
5
Beds
4
Baths
4,000
Sq Ft
$427/Sq Ft
Est. Value
About This Home
This home is located at 9 Timothy Dr, Andover, MA 01810 and is currently estimated at $1,706,497, approximately $426 per square foot. 9 Timothy Dr is a home located in Essex County with nearby schools including South Elementary School, Doherty Middle School, and Andover High School.
Ownership History
Date
Name
Owned For
Owner Type
Purchase Details
Closed on
Aug 13, 2024
Sold by
Ciaccio John and Ciaccio Danielle
Bought by
Ciaccio Lt and Ciacco
Current Estimated Value
Purchase Details
Closed on
Aug 31, 2016
Sold by
Aulbach Kenneth H and Aulbach Kristen G
Bought by
Ciaccio John and Ciaccio Danielle
Home Financials for this Owner
Home Financials are based on the most recent Mortgage that was taken out on this home.
Original Mortgage
$523,250
Interest Rate
3.45%
Mortgage Type
Purchase Money Mortgage
Purchase Details
Closed on
Mar 1, 2004
Sold by
Whirty Robert and Whirty Merit A
Bought by
Aulbach Kenneth H and Aulbach Kristen G
Purchase Details
Closed on
Dec 16, 1996
Sold by
Benson Lucille G
Bought by
Whirty Robert F
Create a Home Valuation Report for This Property
The Home Valuation Report is an in-depth analysis detailing your home's value as well as a comparison with similar homes in the area
Home Values in the Area
Average Home Value in this Area
Purchase History
| Date | Buyer | Sale Price | Title Company |
|---|---|---|---|
| Ciaccio Lt | -- | None Available | |
| Ciaccio Lt | -- | None Available | |
| Ciaccio John | $945,000 | -- | |
| Aulbach Kenneth H | $737,500 | -- | |
| Whirty Robert F | $390,000 | -- | |
| Aulbach Kenneth H | $737,500 | -- | |
| Whirty Robert F | $390,000 | -- |
Source: Public Records
Mortgage History
| Date | Status | Borrower | Loan Amount |
|---|---|---|---|
| Previous Owner | Ciaccio John | $523,250 | |
| Previous Owner | Whirty Robert F | $25,000 |
Source: Public Records
Tax History
| Year | Tax Paid | Tax Assessment Tax Assessment Total Assessment is a certain percentage of the fair market value that is determined by local assessors to be the total taxable value of land and additions on the property. | Land | Improvement |
|---|---|---|---|---|
| 2024 | $14,947 | $1,160,500 | $583,700 | $576,800 |
| 2023 | $14,333 | $1,049,300 | $525,800 | $523,500 |
| 2022 | $13,699 | $938,300 | $457,200 | $481,100 |
| 2021 | $13,156 | $860,400 | $415,500 | $444,900 |
| 2020 | $12,668 | $844,000 | $405,300 | $438,700 |
| 2019 | $12,578 | $823,700 | $393,600 | $430,100 |
| 2018 | $12,137 | $776,000 | $378,400 | $397,600 |
| 2017 | $11,660 | $768,100 | $370,800 | $397,300 |
| 2016 | $11,429 | $771,200 | $370,800 | $400,400 |
| 2015 | $11,001 | $734,900 | $356,400 | $378,500 |
Source: Public Records
Map
Nearby Homes
Your Personal Tour Guide
Ask me questions while you tour the home.