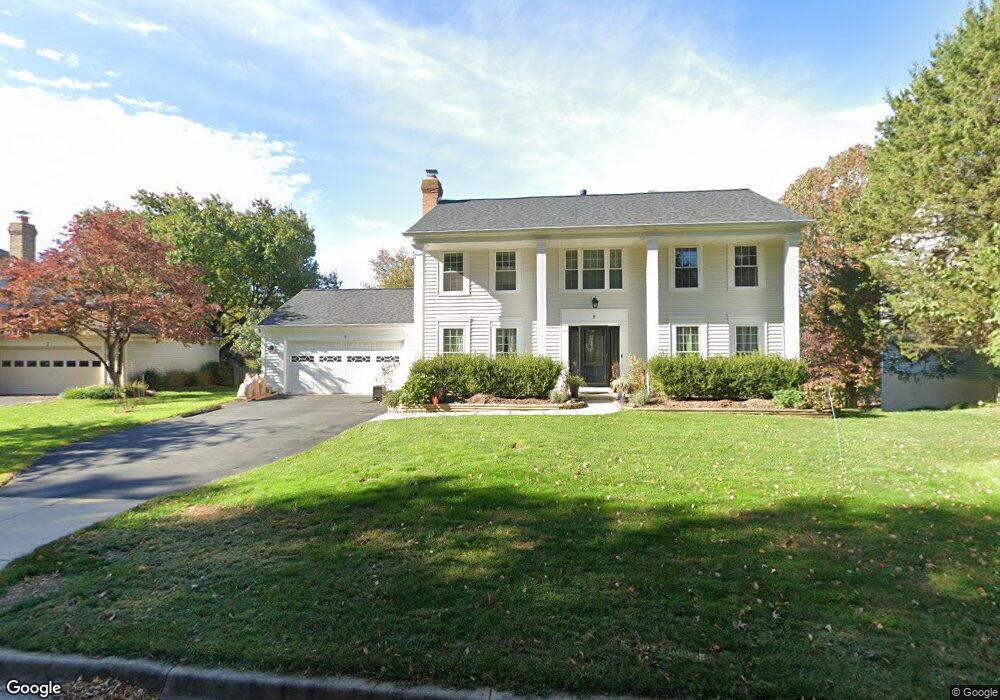
9 Trudy Way Gaithersburg, MD 20878
Estimated Value: $714,336 - $755,000
4
Beds
3
Baths
2,080
Sq Ft
$352/Sq Ft
Est. Value
About This Home
This home is located at 9 Trudy Way, Gaithersburg, MD 20878 and is currently estimated at $731,834, approximately $351 per square foot. 9 Trudy Way is a home located in Montgomery County with nearby schools including Brown Station Elementary School, Lakelands Park Middle School, and Quince Orchard High School.
Ownership History
Date
Name
Owned For
Owner Type
Purchase Details
Closed on
Sep 5, 2008
Sold by
Richter Ralph A
Bought by
Nathwani Jay
Current Estimated Value
Home Financials for this Owner
Home Financials are based on the most recent Mortgage that was taken out on this home.
Original Mortgage
$400,000
Outstanding Balance
$268,210
Interest Rate
6.69%
Mortgage Type
Purchase Money Mortgage
Estimated Equity
$463,624
Purchase Details
Closed on
Aug 21, 2008
Sold by
Richter Ralph A
Bought by
Nathwani Jay
Home Financials for this Owner
Home Financials are based on the most recent Mortgage that was taken out on this home.
Original Mortgage
$400,000
Outstanding Balance
$268,210
Interest Rate
6.69%
Mortgage Type
Purchase Money Mortgage
Estimated Equity
$463,624
Purchase Details
Closed on
Sep 16, 1994
Sold by
Boush Joseph M
Bought by
Richter Ralph A
Home Financials for this Owner
Home Financials are based on the most recent Mortgage that was taken out on this home.
Original Mortgage
$184,000
Interest Rate
8.38%
Create a Home Valuation Report for This Property
The Home Valuation Report is an in-depth analysis detailing your home's value as well as a comparison with similar homes in the area
Home Values in the Area
Average Home Value in this Area
Purchase History
| Date | Buyer | Sale Price | Title Company |
|---|---|---|---|
| Nathwani Jay | $501,000 | -- | |
| Nathwani Jay | $501,000 | -- | |
| Richter Ralph A | $216,000 | -- |
Source: Public Records
Mortgage History
| Date | Status | Borrower | Loan Amount |
|---|---|---|---|
| Open | Nathwani Jay | $400,000 | |
| Closed | Nathwani Jay | $400,000 | |
| Previous Owner | Richter Ralph A | $184,000 |
Source: Public Records
Tax History Compared to Growth
Tax History
| Year | Tax Paid | Tax Assessment Tax Assessment Total Assessment is a certain percentage of the fair market value that is determined by local assessors to be the total taxable value of land and additions on the property. | Land | Improvement |
|---|---|---|---|---|
| 2025 | $7,284 | $559,733 | -- | -- |
| 2024 | $7,284 | $531,567 | $0 | $0 |
| 2023 | $6,184 | $503,400 | $244,400 | $259,000 |
| 2022 | $6,095 | $483,900 | $0 | $0 |
| 2021 | $5,551 | $464,400 | $0 | $0 |
| 2020 | $10,487 | $444,900 | $244,400 | $200,500 |
| 2019 | $5,229 | $444,900 | $244,400 | $200,500 |
| 2018 | $5,235 | $444,900 | $244,400 | $200,500 |
| 2017 | $5,256 | $460,200 | $0 | $0 |
| 2016 | $4,893 | $434,933 | $0 | $0 |
| 2015 | $4,893 | $409,667 | $0 | $0 |
| 2014 | $4,893 | $384,400 | $0 | $0 |
Source: Public Records
Map
Nearby Homes
- 922 Pheasant Run Dr
- 17624 Longdraft Rd
- 210 Twelve Oaks Dr
- 730 Quince Orchard Blvd Unit 730-10
- 776 Quince Orchard Blvd Unit 102
- 10 Melmark Ct
- 828 Quince Orchard Blvd Unit T2
- 828 Quince Orchard Blvd Unit 828-10
- 17724 Garrett Dr
- 838 Quince Orchard Blvd Unit 838-102
- 768 Quince Orchard Blvd Unit 768-101
- 824 Quince Orchard Blvd Unit 824-202
- 824 Quince Orchard Blvd Unit 24
- 30 Pavilion Dr
- 856 Quince Orchard Blvd Unit 856-P1
- 762 Quince Orchard Blvd Unit 101
- 818 Quince Orchard Blvd Unit 202
- 886 Quince Orchard Blvd Unit T1
- 784 Quince Orchard Blvd Unit 784-201
- 788 Quince Orchard Blvd Unit 201
- 11 Trudy Way
- 7 Trudy Way
- 928 Pointer Ridge Dr
- 930 Pointer Ridge Dr
- 13 Trudy Way
- 926 Pointer Ridge Dr
- 6 Trudy Way
- 5 Trudy Way
- 932 Pointer Ridge Dr
- 8 Trudy Way
- 924 Pointer Ridge Dr
- 15 Trudy Way
- 209 Sportsman Way
- 211 Sportsman Way
- 3 Trudy Way
- 934 Pointer Ridge Dr
- 12 Trudy Way
- 207 Sportsman Way
- 937 Pointer Ridge Dr
- 922 Pointer Ridge Dr