Estimated Value: $297,000 - $338,000
4
Beds
3
Baths
2,292
Sq Ft
$138/Sq Ft
Est. Value
About This Home
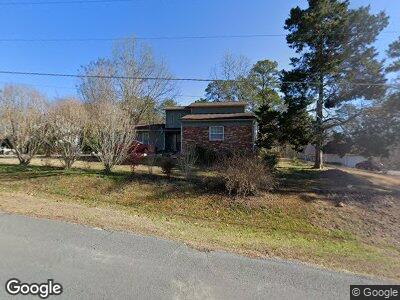
This home is located at 9 Twin Ct SE, Rome, GA 30161 and is currently estimated at $316,764, approximately $138 per square foot. 9 Twin Ct SE is a home located in Floyd County with nearby schools including Pepperell Middle School, Pepperell High School, and Montessori School of Rome.
Ownership History
Date
Name
Owned For
Owner Type
Purchase Details
Closed on
Sep 15, 2011
Sold by
Lamb Dale L
Bought by
Lamb Dale L
Current Estimated Value
Home Financials for this Owner
Home Financials are based on the most recent Mortgage that was taken out on this home.
Original Mortgage
$112,009
Interest Rate
4.4%
Mortgage Type
FHA
Purchase Details
Closed on
Mar 28, 1979
Sold by
Smith Jerry D and Smith Jacqueline A
Bought by
Park Young Joe and Ye Sook
Purchase Details
Closed on
Apr 25, 1977
Sold by
Brock Brock R and Brock Frances B
Bought by
Smith Jerry D and Smith Jacqueline A
Purchase Details
Closed on
Sep 6, 1974
Sold by
Mason Bennie F and Nancy Carol
Bought by
Brock Brock R and Brock Frances B
Purchase Details
Closed on
Aug 11, 1972
Sold by
Mcdonald Johnny L
Bought by
Mason Bennie F and Nancy Carol
Purchase Details
Closed on
Feb 9, 1972
Sold by
Vaughn Joe H
Bought by
Mcdonald Johnny L
Purchase Details
Closed on
Jan 4, 1963
Bought by
Vaughn Joe H
Create a Home Valuation Report for This Property
The Home Valuation Report is an in-depth analysis detailing your home's value as well as a comparison with similar homes in the area
Home Values in the Area
Average Home Value in this Area
Purchase History
| Date | Buyer | Sale Price | Title Company |
|---|---|---|---|
| Lamb Dale L | -- | -- | |
| Lamb Dale L | $115,000 | -- | |
| Park Young Joe | $41,400 | -- | |
| Smith Jerry D | $39,500 | -- | |
| Brock Brock R | $9,900 | -- | |
| Mason Bennie F | $32,500 | -- | |
| Mcdonald Johnny L | $6,000 | -- | |
| Vaughn Joe H | -- | -- |
Source: Public Records
Mortgage History
| Date | Status | Borrower | Loan Amount |
|---|---|---|---|
| Open | -- | $50,000 | |
| Open | Lamb Dale L | $88,000 | |
| Closed | Lamb Dale L | $20,000 | |
| Closed | Lamb Dale L | $112,009 |
Source: Public Records
Tax History Compared to Growth
Tax History
| Year | Tax Paid | Tax Assessment Tax Assessment Total Assessment is a certain percentage of the fair market value that is determined by local assessors to be the total taxable value of land and additions on the property. | Land | Improvement |
|---|---|---|---|---|
| 2024 | $1,513 | $97,860 | $9,025 | $88,835 |
| 2023 | $1,397 | $90,550 | $8,022 | $82,528 |
| 2022 | $1,175 | $75,802 | $6,518 | $69,284 |
| 2021 | $1,070 | $69,075 | $6,017 | $63,058 |
| 2020 | $933 | $61,264 | $4,763 | $56,501 |
| 2019 | $797 | $54,897 | $4,763 | $50,134 |
| 2018 | $748 | $52,331 | $4,763 | $47,568 |
| 2017 | $727 | $51,087 | $4,763 | $46,324 |
| 2016 | $724 | $50,440 | $4,760 | $45,680 |
| 2015 | $1,290 | $44,273 | $4,760 | $39,513 |
| 2014 | $1,290 | $44,273 | $4,760 | $39,513 |
Source: Public Records
Map
Nearby Homes
- 11 Cambridge Dr SE
- 168 Wellington Way SE
- 40 Wellington Way SE
- 36 Coventry Dr SE
- 85 Cambridge Dr SE
- 0 Wellington Way SE Unit 7374604
- 0 Wellington Way SE Unit 7374602
- 0 Wellington Way SE Unit 20180069
- 0 Wellington Way SE Unit 20180068
- 102 Margo Trail SE
- 22 Coventry Dr SE
- 20 Coventry Dr SE
- 313 Chateau Dr SE
- 211 Chateau Dr SE
- 0 Warwick Way SE Unit 20129016
- 2 Saddlebrook Dr SE
- 23 Saddlebrook Dr SE
- 31 Saddlebrook Dr SE
- 30 Saddlebrook Dr SE
- 35 Saddle Mountain Rd SE
- 9 Twin Ct SE
- 00 Margo Trail SE
- 7 Twin Ct SE
- 11 Twin Ct SE
- 0 Twin Ct SE Unit 7458358
- 0 Twin Ct SE Unit 7293196
- 0 Twin Ct SE Unit 3287333
- 0 Twin Ct SE Unit 8366133
- 0 Twin Ct SE Unit 7631476
- 0 Twin Ct SE
- 10 Twin Ct SE
- 9 Old Twickenham Rd SE
- 3 Wellington Way SE
- 2 Wellington Way SE
- 2 Margo Trail SE
- 5 Wellington Way SE
- 4 Wellington Way SE
- 9 Twickenham Rd SE
- 3 Margo Trail SE
- 1 Twin Ct SE