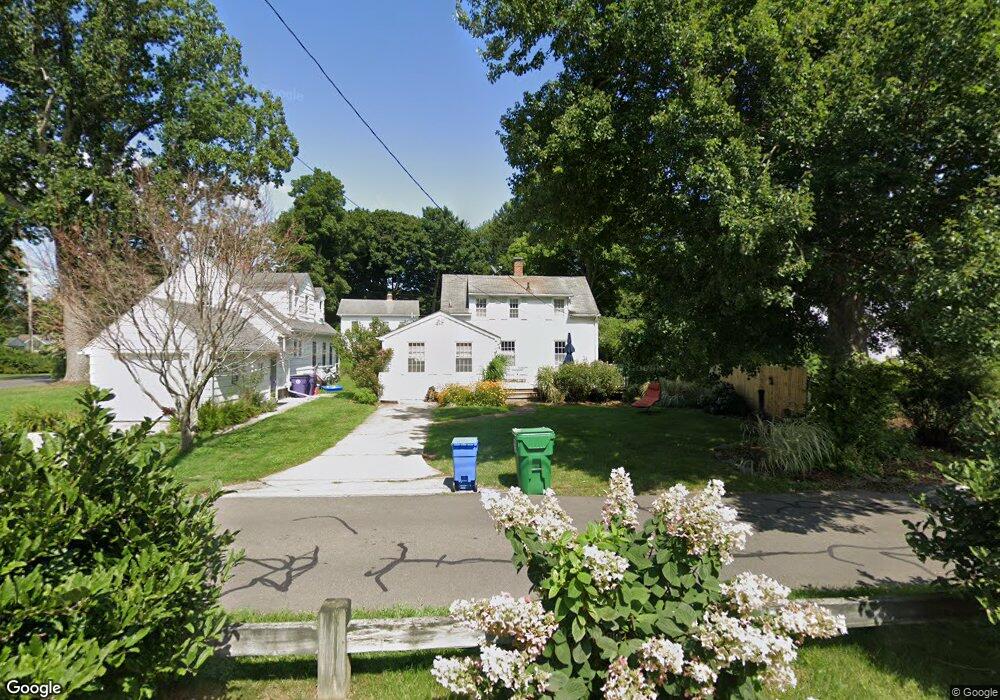
9 W Overshores Madison, CT 06443
Estimated Value: $672,000 - $822,000
2
Beds
2
Baths
1,218
Sq Ft
$613/Sq Ft
Est. Value
About This Home
This home is located at 9 W Overshores, Madison, CT 06443 and is currently estimated at $746,495, approximately $612 per square foot. 9 W Overshores is a home located in New Haven County with nearby schools including Walter C. Polson Upper Middle School, Daniel Hand High School, and Our Lady of Mercy Preparatory Academy.
Ownership History
Date
Name
Owned For
Owner Type
Purchase Details
Closed on
May 28, 2021
Sold by
Boudreau John N
Bought by
Boudreau John N and Boudreau Winifred T
Current Estimated Value
Home Financials for this Owner
Home Financials are based on the most recent Mortgage that was taken out on this home.
Original Mortgage
$214,000
Interest Rate
3%
Mortgage Type
Stand Alone Refi Refinance Of Original Loan
Purchase Details
Closed on
Jun 17, 2004
Sold by
Finer Mark J and Finer Heather G
Bought by
Boudreau John M and Boudreau Winifred S
Purchase Details
Closed on
May 18, 1998
Sold by
Regan Martin J
Bought by
Feiner Mark J and Feiner Heather G
Purchase Details
Closed on
May 10, 1995
Sold by
Boulton John D and Boulton Sharon A
Bought by
Regan Martin J
Create a Home Valuation Report for This Property
The Home Valuation Report is an in-depth analysis detailing your home's value as well as a comparison with similar homes in the area
Home Values in the Area
Average Home Value in this Area
Purchase History
| Date | Buyer | Sale Price | Title Company |
|---|---|---|---|
| Boudreau John N | -- | None Available | |
| Boudreau John N | -- | None Available | |
| Boudreau John M | $350,000 | -- | |
| Feiner Mark J | $150,000 | -- | |
| Regan Martin J | $140,000 | -- | |
| Boudreau John M | $350,000 | -- | |
| Feiner Mark J | $150,000 | -- | |
| Regan Martin J | $140,000 | -- |
Source: Public Records
Mortgage History
| Date | Status | Borrower | Loan Amount |
|---|---|---|---|
| Previous Owner | Boudreau John N | $214,000 | |
| Previous Owner | Regan Martin J | $281,000 | |
| Previous Owner | Regan Martin J | $340,000 |
Source: Public Records
Tax History Compared to Growth
Tax History
| Year | Tax Paid | Tax Assessment Tax Assessment Total Assessment is a certain percentage of the fair market value that is determined by local assessors to be the total taxable value of land and additions on the property. | Land | Improvement |
|---|---|---|---|---|
| 2025 | $8,703 | $388,000 | $260,500 | $127,500 |
| 2024 | $8,536 | $388,000 | $260,500 | $127,500 |
| 2023 | $7,750 | $258,600 | $185,200 | $73,400 |
| 2022 | $7,605 | $258,600 | $185,200 | $73,400 |
| 2021 | $7,461 | $258,600 | $185,200 | $73,400 |
| 2020 | $7,331 | $258,600 | $185,200 | $73,400 |
| 2019 | $7,331 | $258,600 | $185,200 | $73,400 |
| 2018 | $7,086 | $252,700 | $173,200 | $79,500 |
| 2017 | $6,899 | $252,700 | $173,200 | $79,500 |
| 2016 | $6,694 | $252,700 | $173,200 | $79,500 |
| 2015 | $6,510 | $252,700 | $173,200 | $79,500 |
| 2014 | $7,397 | $293,900 | $224,200 | $69,700 |
Source: Public Records
Map
Nearby Homes
- 18 Kelsey Place
- 115 Harbor Ave
- 146 Chittenden Field Ln
- 31 Stony Lane Lot 3 Rd
- 31 Stony Lane Lot 6 Rd
- 31 Stony Lane Lot 1 Rd
- 31 Stony Lane Lot 2 Rd
- 9 Old Farms Rd
- 3 Arrowhead Rd
- 108 Boston Post Rd
- 7 Derenthal Dr
- 67 Boston Post Rd Unit 8
- 37 Lantern Hill Rd
- 15 Highland Terrace
- 513 Boston Post Rd
- 30 Meeting House Ln
- 75 Fairview Dr
- 10 Middle Beach Rd W
- 42 Horseshoe Rd
- 29 Circle Beach Rd