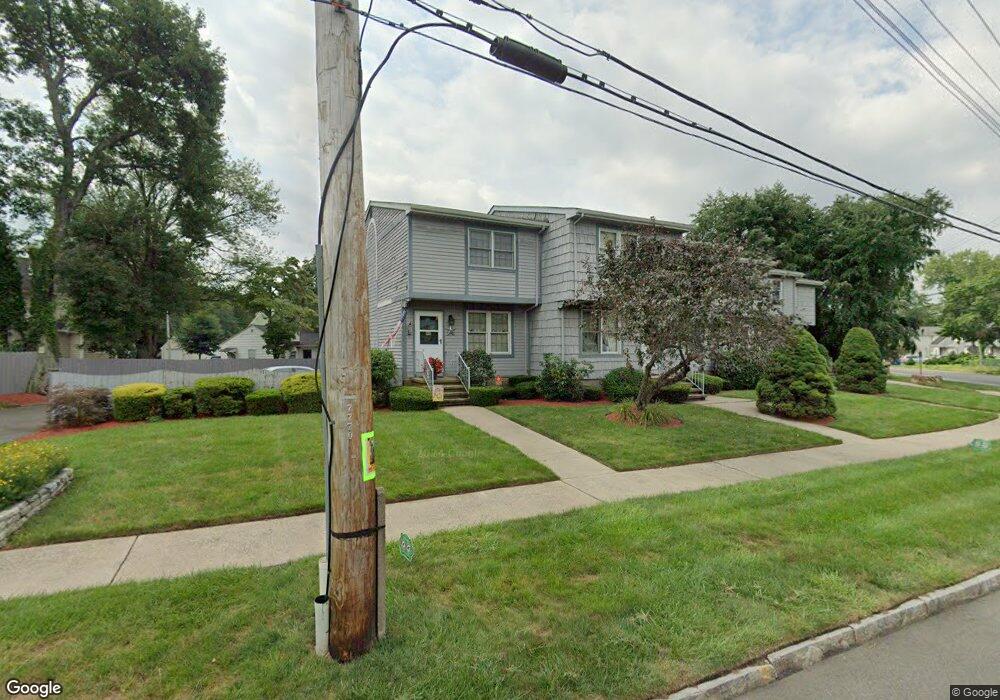
9 Westminster St New Haven, CT 06513
Quinnipiac Meadows NeighborhoodEstimated Value: $158,000 - $299,000
2
Beds
2
Baths
1,184
Sq Ft
$199/Sq Ft
Est. Value
About This Home
This home is located at 9 Westminster St, New Haven, CT 06513 and is currently estimated at $235,733, approximately $199 per square foot. 9 Westminster St is a home located in New Haven County with nearby schools including Bishop Woods Architecture and Design Magnet School and St Francis & St Rose Of Lima School.
Ownership History
Date
Name
Owned For
Owner Type
Purchase Details
Closed on
Nov 27, 2019
Sold by
Nardone Corey
Bought by
Ramirez Ruby
Current Estimated Value
Home Financials for this Owner
Home Financials are based on the most recent Mortgage that was taken out on this home.
Original Mortgage
$116,138
Outstanding Balance
$102,592
Interest Rate
3.7%
Mortgage Type
Purchase Money Mortgage
Estimated Equity
$133,141
Purchase Details
Closed on
May 26, 2017
Sold by
Kern Christine M
Bought by
Nardone Corey
Home Financials for this Owner
Home Financials are based on the most recent Mortgage that was taken out on this home.
Original Mortgage
$91,350
Interest Rate
4.08%
Mortgage Type
Purchase Money Mortgage
Purchase Details
Closed on
Sep 26, 2011
Sold by
Blaho Emil A and Worrell Maryellen
Bought by
Kern Fred R and Kern Christine M
Purchase Details
Closed on
Apr 5, 1989
Sold by
Blaho Emil A
Bought by
Kern Fred R
Home Financials for this Owner
Home Financials are based on the most recent Mortgage that was taken out on this home.
Original Mortgage
$81,350
Interest Rate
10.71%
Create a Home Valuation Report for This Property
The Home Valuation Report is an in-depth analysis detailing your home's value as well as a comparison with similar homes in the area
Home Values in the Area
Average Home Value in this Area
Purchase History
| Date | Buyer | Sale Price | Title Company |
|---|---|---|---|
| Ramirez Ruby | $122,250 | None Available | |
| Nardone Corey | $101,500 | -- | |
| Kern Fred R | -- | -- | |
| Kern Fred R | $108,500 | -- |
Source: Public Records
Mortgage History
| Date | Status | Borrower | Loan Amount |
|---|---|---|---|
| Open | Ramirez Ruby | $116,138 | |
| Previous Owner | Kern Fred R | $91,350 | |
| Previous Owner | Kern Fred R | $73,600 | |
| Previous Owner | Kern Fred R | $80,000 | |
| Previous Owner | Kern Fred R | $81,350 |
Source: Public Records
Tax History Compared to Growth
Tax History
| Year | Tax Paid | Tax Assessment Tax Assessment Total Assessment is a certain percentage of the fair market value that is determined by local assessors to be the total taxable value of land and additions on the property. | Land | Improvement |
|---|---|---|---|---|
| 2025 | $3,707 | $94,080 | $0 | $94,080 |
| 2024 | $3,622 | $94,080 | $0 | $94,080 |
| 2023 | $3,500 | $94,080 | $0 | $94,080 |
| 2022 | $3,740 | $94,080 | $0 | $94,080 |
| 2021 | $3,621 | $82,530 | $0 | $82,530 |
| 2020 | $3,621 | $82,530 | $0 | $82,530 |
| 2019 | $3,547 | $82,530 | $0 | $82,530 |
| 2018 | $3,547 | $82,530 | $0 | $82,530 |
| 2017 | $3,192 | $82,530 | $0 | $82,530 |
| 2016 | $3,653 | $87,920 | $0 | $87,920 |
| 2015 | $3,653 | $87,920 | $0 | $87,920 |
| 2014 | $3,653 | $87,920 | $0 | $87,920 |
Source: Public Records
Map
Nearby Homes
- 1706 Quinnipiac Ave
- 15 Glen Haven Rd
- 174 Weybosset St
- 175 Weybosset St
- 170 Weybosset St
- 560 Middletown Ave
- 81 Melrose Dr
- 466 Middletown Ave Unit 29
- 300 Foxon Hill Rd
- 1445 Quinnipiac Ave
- 15 Zolan Dr
- 15 Donna Dr Unit A1
- 40 Donna Dr Unit C2
- 1423 Quinnipiac Ave Unit 115
- 1423 Quinnipiac Ave Unit 709
- 1423 Quinnipiac Ave Unit 602
- 1423 Quinnipiac Ave Unit 707
- 1423 Quinnipiac Ave Unit 508
- 1423 Quinnipiac Ave Unit 103
- 1423 Quinnipiac Ave Unit 108
- 7 Westminster St
- 5 Westminster St
- 3 Westminster St
- 1 Westminster St
- 1 Westminster St Unit 1
- 9 Westminster St Unit 9
- 7 Westminster St Unit 7
- 675 Middletown Ave Unit 2
- 675 Middletown Ave Unit 1
- 675 Middletown Ave Unit A-1
- 671 Middletown Ave Unit 2
- 671 Middletown Ave Unit 1
- 671 Middletown Ave Unit B1
- 11 Westminster St
- 306 Weybosset St
- 296 Weybosset St
- 192 Gando Dr
- 310 Weybosset St
- 286 Weybosset St
- 665 Middletown Ave