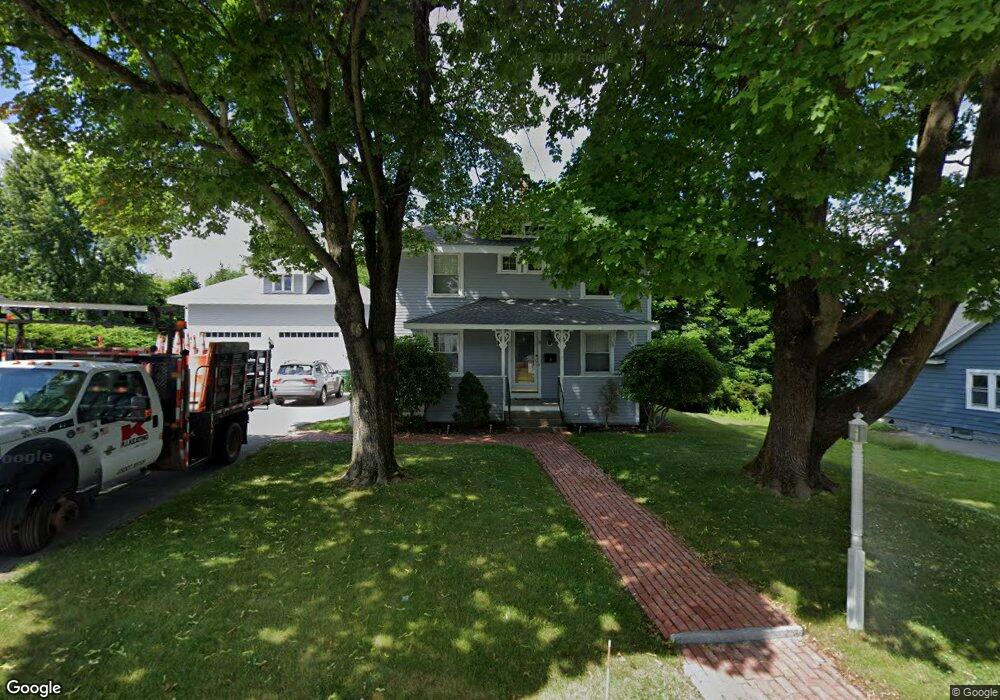
9 Wethered St Auburn, MA 01501
Stoneville NeighborhoodEstimated Value: $534,000 - $561,000
3
Beds
2
Baths
1,900
Sq Ft
$291/Sq Ft
Est. Value
About This Home
This home is located at 9 Wethered St, Auburn, MA 01501 and is currently estimated at $552,970, approximately $291 per square foot. 9 Wethered St is a home located in Worcester County with nearby schools including Auburn Senior High School and Shrewsbury Montessori School - Auburn Campus.
Ownership History
Date
Name
Owned For
Owner Type
Purchase Details
Closed on
May 31, 2005
Sold by
Walckner James A and Walckner Sabrina M
Bought by
Rivera Rolando E and Diaz Beverly
Current Estimated Value
Home Financials for this Owner
Home Financials are based on the most recent Mortgage that was taken out on this home.
Original Mortgage
$210,000
Interest Rate
5.94%
Mortgage Type
Purchase Money Mortgage
Purchase Details
Closed on
Aug 29, 2003
Sold by
Perry Jessica L and Perry Timothy F
Bought by
Walckner James A and Walckner Sabrina M
Home Financials for this Owner
Home Financials are based on the most recent Mortgage that was taken out on this home.
Original Mortgage
$284,905
Interest Rate
5.69%
Mortgage Type
Purchase Money Mortgage
Purchase Details
Closed on
Nov 30, 1994
Sold by
Perry Joseph H
Bought by
Perry Timothy F and Perry Jessica
Create a Home Valuation Report for This Property
The Home Valuation Report is an in-depth analysis detailing your home's value as well as a comparison with similar homes in the area
Home Values in the Area
Average Home Value in this Area
Purchase History
| Date | Buyer | Sale Price | Title Company |
|---|---|---|---|
| Rivera Rolando E | $320,000 | -- | |
| Walckner James A | $299,900 | -- | |
| Perry Timothy F | $60,000 | -- |
Source: Public Records
Mortgage History
| Date | Status | Borrower | Loan Amount |
|---|---|---|---|
| Open | Perry Timothy F | $225,000 | |
| Closed | Rivera Rolando E | $210,000 | |
| Previous Owner | Walckner James A | $284,905 | |
| Previous Owner | Perry Timothy F | $207,000 | |
| Previous Owner | Perry Timothy F | $30,000 |
Source: Public Records
Tax History
| Year | Tax Paid | Tax Assessment Tax Assessment Total Assessment is a certain percentage of the fair market value that is determined by local assessors to be the total taxable value of land and additions on the property. | Land | Improvement |
|---|---|---|---|---|
| 2025 | $69 | $482,300 | $117,900 | $364,400 |
| 2024 | $7,098 | $475,400 | $113,500 | $361,900 |
| 2023 | $6,759 | $425,600 | $103,200 | $322,400 |
| 2022 | $6,202 | $368,700 | $103,200 | $265,500 |
| 2021 | $22,101 | $326,000 | $91,100 | $234,900 |
| 2020 | $5,861 | $326,000 | $91,100 | $234,900 |
| 2019 | $5,489 | $298,000 | $90,300 | $207,700 |
| 2018 | $2,407 | $290,700 | $84,500 | $206,200 |
| 2017 | $2,498 | $282,800 | $76,600 | $206,200 |
| 2016 | $4,846 | $267,900 | $79,000 | $188,900 |
| 2015 | $4,531 | $262,500 | $79,000 | $183,500 |
| 2014 | $4,163 | $240,800 | $75,300 | $165,500 |
Source: Public Records
Map
Nearby Homes
- 40 Bryn Mawr Ave
- 1 Rockland Road Ct
- 177 Oxford St N
- 31-33 Walsh Ave
- 33 Walsh Ave
- 31 Walsh Ave
- 25 Vinal St Unit 28
- 25 Vinal St Unit 26
- 25 Vinal St Unit 29
- 25 Vinal St Unit 30
- 33 Eastford Rd
- 19-20 Williams St
- 5 Commonwealth Ave
- 177 Boyce St
- 328 Oxford St N
- 1-9 Helens Way
- 36 Central St
- 99 Clover St
- 204-212 Hampton St
- 154 Pakachoag St
Your Personal Tour Guide
Ask me questions while you tour the home.