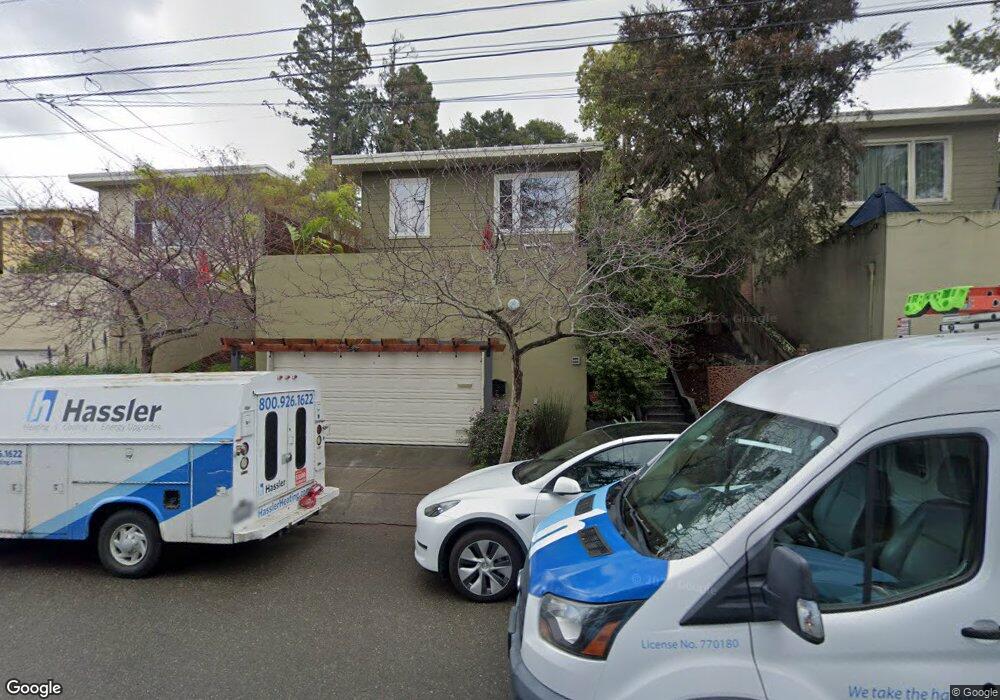
9 Whittle Ct Oakland, CA 94602
Dimond District NeighborhoodEstimated Value: $1,271,000 - $1,457,000
3
Beds
2
Baths
1,643
Sq Ft
$844/Sq Ft
Est. Value
About This Home
This home is located at 9 Whittle Ct, Oakland, CA 94602 and is currently estimated at $1,386,307, approximately $843 per square foot. 9 Whittle Ct is a home located in Alameda County with nearby schools including Sequoia Elementary School, Bret Harte Middle School, and Skyline High School.
Ownership History
Date
Name
Owned For
Owner Type
Purchase Details
Closed on
Jun 15, 2019
Sold by
Moore Timothy L and Moore Starley B
Bought by
Moore Erin A
Current Estimated Value
Purchase Details
Closed on
Nov 11, 2017
Sold by
Sacco Justin S and Sacco Jane E
Bought by
Moore Timothy L and Moore Starley B
Purchase Details
Closed on
Jul 14, 2006
Sold by
Valsamis Peter and Liu Patricia
Bought by
Sacco Justin S and Sacco Jane E
Home Financials for this Owner
Home Financials are based on the most recent Mortgage that was taken out on this home.
Original Mortgage
$459,600
Interest Rate
6.5%
Mortgage Type
Purchase Money Mortgage
Purchase Details
Closed on
Aug 1, 2001
Sold by
Oehrlein Barbara and Stein Family Trust
Bought by
Valsamis Peter and Liu Patricia
Home Financials for this Owner
Home Financials are based on the most recent Mortgage that was taken out on this home.
Original Mortgage
$264,800
Interest Rate
6.62%
Create a Home Valuation Report for This Property
The Home Valuation Report is an in-depth analysis detailing your home's value as well as a comparison with similar homes in the area
Home Values in the Area
Average Home Value in this Area
Purchase History
| Date | Buyer | Sale Price | Title Company |
|---|---|---|---|
| Moore Erin A | -- | None Available | |
| Moore Timothy L | $1,400,000 | Old Republic Title Company | |
| Sacco Justin S | $574,500 | Chicago Title Co | |
| Valsamis Peter | $331,000 | North American Title Co |
Source: Public Records
Mortgage History
| Date | Status | Borrower | Loan Amount |
|---|---|---|---|
| Previous Owner | Sacco Justin S | $459,600 | |
| Previous Owner | Valsamis Peter | $264,800 | |
| Closed | Valsamis Peter | $31,200 |
Source: Public Records
Tax History Compared to Growth
Tax History
| Year | Tax Paid | Tax Assessment Tax Assessment Total Assessment is a certain percentage of the fair market value that is determined by local assessors to be the total taxable value of land and additions on the property. | Land | Improvement |
|---|---|---|---|---|
| 2025 | $21,613 | $1,592,933 | $477,880 | $1,115,053 |
| 2024 | $21,613 | $1,561,700 | $468,510 | $1,093,190 |
| 2023 | $22,883 | $1,531,081 | $459,324 | $1,071,757 |
| 2022 | $22,409 | $1,501,065 | $450,319 | $1,050,746 |
| 2021 | $21,705 | $1,471,637 | $441,491 | $1,030,146 |
| 2020 | $21,228 | $1,438,854 | $431,656 | $1,007,198 |
| 2019 | $20,842 | $1,428,000 | $428,400 | $999,600 |
| 2018 | $20,403 | $1,400,000 | $420,000 | $980,000 |
| 2017 | $10,700 | $712,886 | $198,953 | $513,933 |
| 2016 | $10,379 | $698,911 | $195,053 | $503,858 |
| 2015 | $9,185 | $605,000 | $181,500 | $423,500 |
| 2014 | $9,083 | $580,000 | $174,000 | $406,000 |
Source: Public Records
Map
Nearby Homes
- 3826 Lincoln Ave
- 3847 Fruitvale Ave
- 3887 Forest Hill Ave
- 2240 Macarthur Blvd
- 3477 Boston Ave Unit 4
- 2510 Delmer St
- 3464 Champion St
- 3541 Dimond Ave
- 3853 Rhoda Ave
- 2715 Macarthur Blvd
- 2726 Madeline St
- 2436 Potomac St
- 3873 Coolidge Ave
- 3875 Coolidge Ave
- 3220 Champion St
- 2808 Carmel St
- 2471 Burlington St
- 4019 Rhoda Ave
- 1515 Hampel St
- 3316 Coolidge Ave
- 17 Whittle Ct
- 1 Whittle Ct
- 25 Whittle Ct
- 3844 Whittle Ave
- 6 Whittle Ct
- 33 Whittle Ct
- 3727 Lincoln Ave
- 3850 Whittle Ave
- 3721 Lincoln Ave
- 3715 Lincoln Ave Unit 1
- 3715 Lincoln Ave Unit 10
- 3824 Whittle Ave
- 3735 Lincoln Ave
- 3856 Whittle Ave
- 2302 Damuth St
- 2214 Damuth St
- 2308 Damuth St
- 41 Whittle Ct
- 3743 Lincoln Ave
- 3835 Whittle Ave