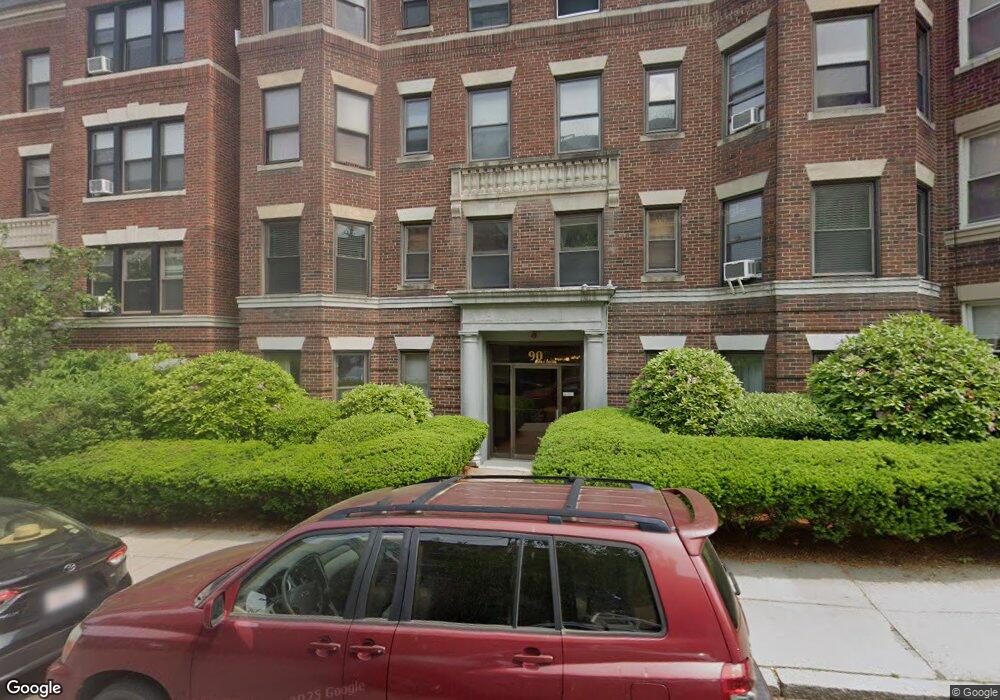
90 Brainerd Rd Unit 10 Allston, MA 02134
Commonwealth NeighborhoodEstimated Value: $379,000 - $412,000
1
Bed
1
Bath
999
Sq Ft
$396/Sq Ft
Est. Value
About This Home
This home is located at 90 Brainerd Rd Unit 10, Allston, MA 02134 and is currently estimated at $395,747, approximately $396 per square foot. 90 Brainerd Rd Unit 10 is a home located in Suffolk County with nearby schools including Boston Green Academy Horace Mann Charter School and Torah Academy.
Ownership History
Date
Name
Owned For
Owner Type
Purchase Details
Closed on
Jun 21, 2019
Sold by
Song Paul
Bought by
Song Rt
Current Estimated Value
Purchase Details
Closed on
Jun 6, 2013
Sold by
Chin-Wen Chiang Robert and Chin-Wen Lee
Bought by
Song Paul
Purchase Details
Closed on
Oct 29, 2010
Sold by
Brainerd Road Condo
Bought by
Chin-Wen Chiang Robert and Chin-Wen Lee
Home Financials for this Owner
Home Financials are based on the most recent Mortgage that was taken out on this home.
Original Mortgage
$100,000
Interest Rate
4.39%
Mortgage Type
Purchase Money Mortgage
Purchase Details
Closed on
Jun 28, 2007
Sold by
Lalibere John
Bought by
Segal Marina
Home Financials for this Owner
Home Financials are based on the most recent Mortgage that was taken out on this home.
Original Mortgage
$157,600
Interest Rate
6.24%
Mortgage Type
Purchase Money Mortgage
Purchase Details
Closed on
Nov 30, 2005
Sold by
Krauss Robert
Bought by
Laliberte John
Home Financials for this Owner
Home Financials are based on the most recent Mortgage that was taken out on this home.
Original Mortgage
$158,400
Interest Rate
6.14%
Mortgage Type
Purchase Money Mortgage
Create a Home Valuation Report for This Property
The Home Valuation Report is an in-depth analysis detailing your home's value as well as a comparison with similar homes in the area
Home Values in the Area
Average Home Value in this Area
Purchase History
| Date | Buyer | Sale Price | Title Company |
|---|---|---|---|
| Song Rt | -- | -- | |
| Song Paul | $230,000 | -- | |
| Chin-Wen Chiang Robert | $183,500 | -- | |
| Segal Marina | $197,000 | -- | |
| Laliberte John | $198,000 | -- |
Source: Public Records
Mortgage History
| Date | Status | Borrower | Loan Amount |
|---|---|---|---|
| Previous Owner | Chin-Wen Chiang Robert | $100,000 | |
| Previous Owner | Segal Marina | $157,600 | |
| Previous Owner | Laliberte John | $158,400 |
Source: Public Records
Tax History
| Year | Tax Paid | Tax Assessment Tax Assessment Total Assessment is a certain percentage of the fair market value that is determined by local assessors to be the total taxable value of land and additions on the property. | Land | Improvement |
|---|---|---|---|---|
| 2025 | $4,095 | $353,600 | $0 | $353,600 |
| 2024 | $3,878 | $355,800 | $0 | $355,800 |
| 2023 | $3,821 | $355,800 | $0 | $355,800 |
| 2022 | $3,651 | $335,600 | $0 | $335,600 |
| 2021 | $3,581 | $335,600 | $0 | $335,600 |
| 2020 | $2,888 | $273,500 | $0 | $273,500 |
| 2019 | $2,826 | $268,100 | $0 | $268,100 |
| 2018 | $2,627 | $250,700 | $0 | $250,700 |
| 2017 | $2,458 | $232,100 | $0 | $232,100 |
| 2016 | $2,466 | $224,200 | $0 | $224,200 |
| 2015 | $2,531 | $209,000 | $0 | $209,000 |
| 2014 | $2,389 | $189,900 | $0 | $189,900 |
Source: Public Records
Map
Nearby Homes
- 85 Brainerd Rd Unit 302
- 85 Brainerd Rd Unit TH7
- 108 Columbia St Unit 1
- 1304 Commonwealth Ave Unit 5
- 239 Kelton St Unit 41
- 239 Kelton St Unit 11
- 285 Corey Rd Unit 4
- 39 Verndale St Unit 39
- 197 Winchester St Unit 1
- 78 Glenville Ave Unit 7
- 36 Bellvista Rd Unit 36
- 10 Scottfield Rd Unit B34
- 10 Scottfield Rd Unit 2
- 83 Glenville Ave
- 130 Glenville Ave
- 5 Spofford Rd Unit 17
- 43 Glenville Ave Unit 11
- 30 Glenville Ave Unit 1
- 39 Glenville Ave Unit 71
- 249 Corey Rd Unit 409
- 90 Brainerd Rd Unit 12A
- 90 Brainerd Rd Unit 17
- 90 Brainerd Rd Unit 21
- 90 Brainerd Rd Unit 20
- 90 Brainerd Rd Unit 19
- 90 Brainerd Rd Unit 18
- 90 Brainerd Rd Unit 16
- 90 Brainerd Rd Unit 15
- 90 Brainerd Rd Unit 14
- 90 Brainerd Rd Unit 11
- 90 Brainerd Rd Unit 9
- 90 Brainerd Rd Unit 8
- 90 Brainerd Rd Unit 7
- 90 Brainerd Rd Unit 6
- 90 Brainerd Rd Unit 5
- 90 Brainerd Rd Unit 4
- 90 Brainerd Rd Unit 3
- 90 Brainerd Rd Unit 2
- 90 Brainerd Rd Unit 1
- 90 Brainerd Rd Unit 505
Your Personal Tour Guide
Ask me questions while you tour the home.