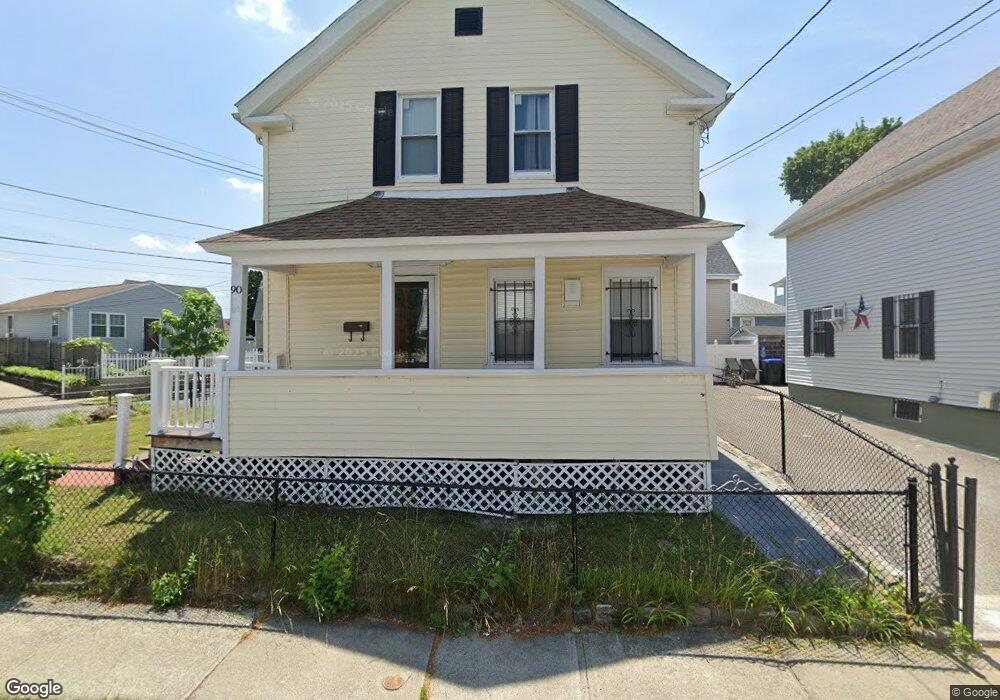
90 Cass St Providence, RI 02905
Washington Park NeighborhoodEstimated Value: $309,000 - $381,000
3
Beds
2
Baths
1,117
Sq Ft
$311/Sq Ft
Est. Value
About This Home
This home is located at 90 Cass St, Providence, RI 02905 and is currently estimated at $347,699, approximately $311 per square foot. 90 Cass St is a home located in Providence County with nearby schools including Highlander Charter School and The Hope Academy.
Ownership History
Date
Name
Owned For
Owner Type
Purchase Details
Closed on
Feb 18, 2011
Sold by
Providence Invest Llc
Bought by
Joseph Emilienne
Current Estimated Value
Home Financials for this Owner
Home Financials are based on the most recent Mortgage that was taken out on this home.
Original Mortgage
$76,022
Outstanding Balance
$51,323
Interest Rate
4.5%
Mortgage Type
FHA
Estimated Equity
$296,376
Purchase Details
Closed on
Jan 12, 2010
Sold by
Bank Of America Na
Bought by
Prov Investments Llc
Purchase Details
Closed on
Jun 26, 2009
Sold by
Corniel Manuel E
Bought by
Bank Of America Na
Purchase Details
Closed on
Feb 13, 2006
Sold by
Landing Properties Llc
Bought by
Corniel Manuel
Purchase Details
Closed on
May 10, 2005
Sold by
Bliss Dolores T and Hicks Anne W
Bought by
Landing Properties Llc
Create a Home Valuation Report for This Property
The Home Valuation Report is an in-depth analysis detailing your home's value as well as a comparison with similar homes in the area
Home Values in the Area
Average Home Value in this Area
Purchase History
| Date | Buyer | Sale Price | Title Company |
|---|---|---|---|
| Joseph Emilienne | $78,000 | -- | |
| Prov Investments Llc | $32,500 | -- | |
| Bank Of America Na | $42,500 | -- | |
| Corniel Manuel | $196,000 | -- | |
| Landing Properties Llc | $90,000 | -- |
Source: Public Records
Mortgage History
| Date | Status | Borrower | Loan Amount |
|---|---|---|---|
| Open | Landing Properties Llc | $76,022 | |
| Closed | Landing Properties Llc | $2,500 |
Source: Public Records
Tax History
| Year | Tax Paid | Tax Assessment Tax Assessment Total Assessment is a certain percentage of the fair market value that is determined by local assessors to be the total taxable value of land and additions on the property. | Land | Improvement |
|---|---|---|---|---|
| 2025 | $2,523 | $300,300 | $118,100 | $182,200 |
| 2024 | $4,009 | $218,500 | $74,800 | $143,700 |
| 2023 | $4,009 | $218,500 | $74,800 | $143,700 |
| 2022 | $3,889 | $218,500 | $74,800 | $143,700 |
| 2021 | $3,117 | $126,900 | $33,000 | $93,900 |
| 2020 | $3,117 | $126,900 | $33,000 | $93,900 |
| 2019 | $3,117 | $126,900 | $33,000 | $93,900 |
| 2018 | $2,896 | $90,600 | $30,000 | $60,600 |
| 2017 | $2,896 | $90,600 | $30,000 | $60,600 |
| 2016 | $2,896 | $90,600 | $30,000 | $60,600 |
| 2015 | $2,919 | $88,200 | $30,000 | $58,200 |
| 2014 | $2,977 | $88,200 | $30,000 | $58,200 |
| 2013 | $2,977 | $88,200 | $30,000 | $58,200 |
Source: Public Records
Map
Nearby Homes
Your Personal Tour Guide
Ask me questions while you tour the home.