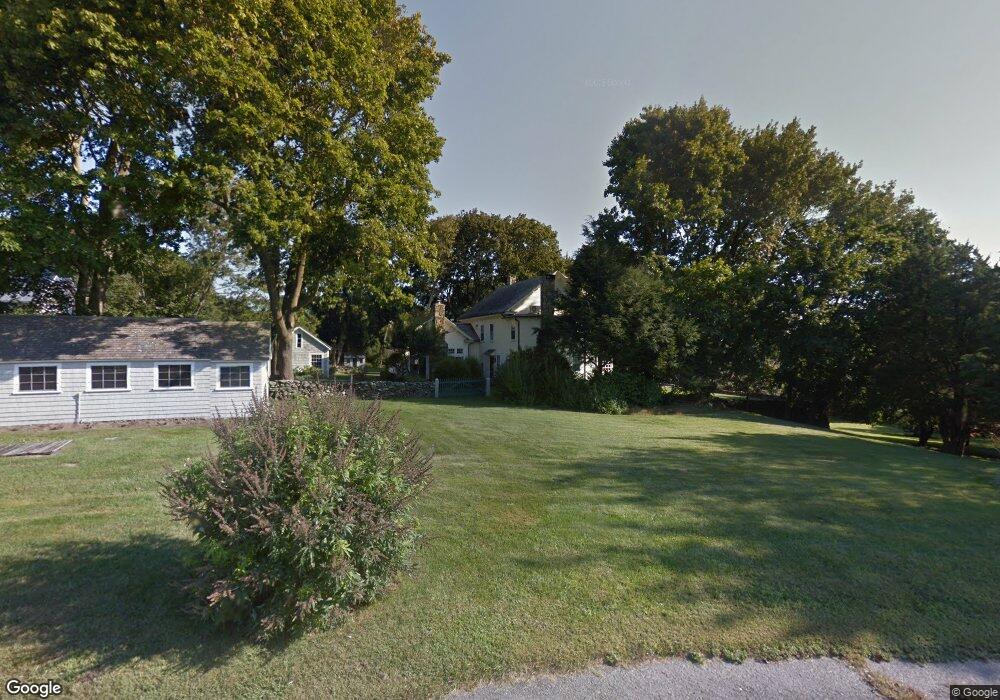
90 Cedar Hill Dr Jamestown, RI 02835
Jamestown Shores NeighborhoodEstimated Value: $1,604,000 - $2,786,000
4
Beds
3
Baths
3,630
Sq Ft
$657/Sq Ft
Est. Value
About This Home
This home is located at 90 Cedar Hill Dr, Jamestown, RI 02835 and is currently estimated at $2,383,615, approximately $656 per square foot. 90 Cedar Hill Dr is a home located in Newport County with nearby schools including Melrose Avenue School and Lawn Avenue School.
Ownership History
Date
Name
Owned For
Owner Type
Purchase Details
Closed on
Dec 17, 2021
Sold by
Qprt Carol L Schatzman
Bought by
Qprt Carol L Schatzman
Current Estimated Value
Purchase Details
Closed on
Oct 28, 2002
Sold by
Kinney Eleanor H
Bought by
Schatzman Carol L
Purchase Details
Closed on
Dec 14, 1995
Sold by
Mccabe Charles H
Bought by
Kinney Eleanor H
Home Financials for this Owner
Home Financials are based on the most recent Mortgage that was taken out on this home.
Original Mortgage
$300,000
Interest Rate
7.43%
Create a Home Valuation Report for This Property
The Home Valuation Report is an in-depth analysis detailing your home's value as well as a comparison with similar homes in the area
Home Values in the Area
Average Home Value in this Area
Purchase History
| Date | Buyer | Sale Price | Title Company |
|---|---|---|---|
| Qprt Carol L Schatzman | -- | None Available | |
| Schatzman Carol L | $1,425,000 | -- | |
| Kinney Eleanor H | $675,000 | -- |
Source: Public Records
Mortgage History
| Date | Status | Borrower | Loan Amount |
|---|---|---|---|
| Previous Owner | Kinney Eleanor H | $300,000 |
Source: Public Records
Tax History Compared to Growth
Tax History
| Year | Tax Paid | Tax Assessment Tax Assessment Total Assessment is a certain percentage of the fair market value that is determined by local assessors to be the total taxable value of land and additions on the property. | Land | Improvement |
|---|---|---|---|---|
| 2025 | $11,667 | $2,068,700 | $688,600 | $1,380,100 |
| 2024 | $12,971 | $1,809,100 | $579,300 | $1,229,800 |
| 2023 | $11,095 | $1,589,600 | $579,300 | $1,010,300 |
| 2022 | $10,053 | $1,480,500 | $579,300 | $901,200 |
| 2021 | $10,826 | $1,307,500 | $553,600 | $753,900 |
| 2020 | $10,552 | $1,307,500 | $553,600 | $753,900 |
| 2019 | $10,525 | $1,307,500 | $553,600 | $753,900 |
| 2018 | $9,139 | $1,032,700 | $525,300 | $507,400 |
| 2017 | $8,943 | $1,032,700 | $525,300 | $507,400 |
| 2016 | $8,861 | $1,032,700 | $525,300 | $507,400 |
| 2015 | $9,247 | $1,053,200 | $497,400 | $555,800 |
| 2014 | $9,216 | $1,053,200 | $497,400 | $555,800 |
Source: Public Records
Map
Nearby Homes