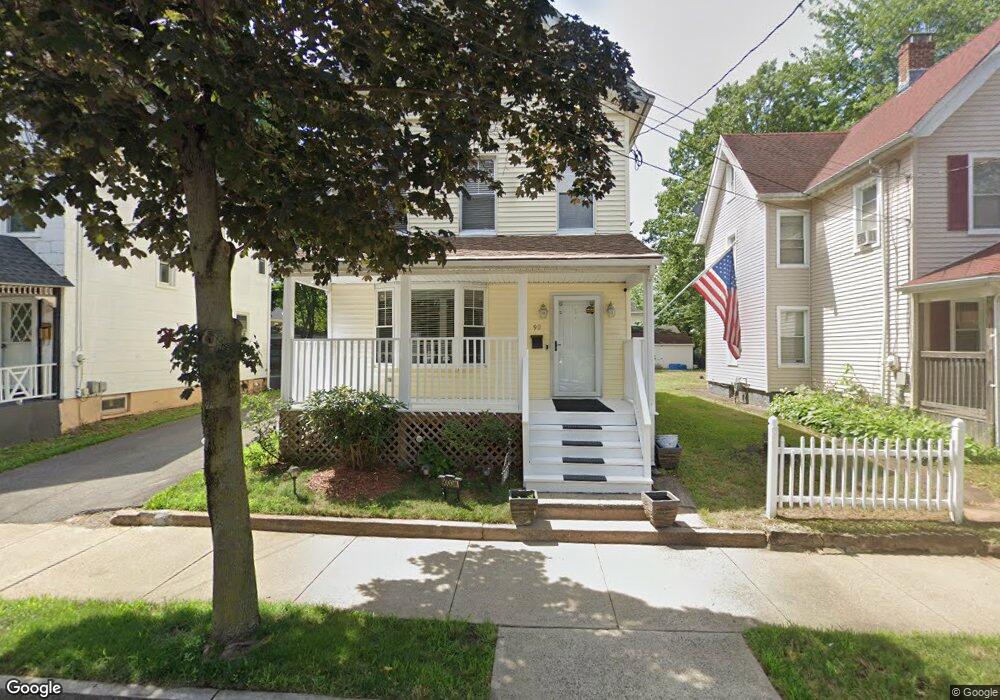
90 Dorman St New Haven, CT 06511
Newhallville NeighborhoodEstimated Value: $344,000 - $405,486
4
Beds
3
Baths
2,546
Sq Ft
$150/Sq Ft
Est. Value
About This Home
This home is located at 90 Dorman St, New Haven, CT 06511 and is currently estimated at $382,622, approximately $150 per square foot. 90 Dorman St is a home located in New Haven County with nearby schools including King/Robinson Magnet School and Highville Charter School.
Ownership History
Date
Name
Owned For
Owner Type
Purchase Details
Closed on
Feb 14, 2012
Sold by
Chfa
Bought by
Martin Tony
Current Estimated Value
Purchase Details
Closed on
Jun 6, 1996
Sold by
Centerbank
Bought by
Martin Tony M and Martin Tracy D
Purchase Details
Closed on
May 24, 1994
Sold by
Trader Jacqueline L
Bought by
Centerbank
Create a Home Valuation Report for This Property
The Home Valuation Report is an in-depth analysis detailing your home's value as well as a comparison with similar homes in the area
Home Values in the Area
Average Home Value in this Area
Purchase History
| Date | Buyer | Sale Price | Title Company |
|---|---|---|---|
| Martin Tony | $60,000 | -- | |
| Martin Tony M | $15,000 | -- | |
| Centerbank | $39,085 | -- |
Source: Public Records
Mortgage History
| Date | Status | Borrower | Loan Amount |
|---|---|---|---|
| Open | Centerbank | $141,951 | |
| Previous Owner | Centerbank | $150,000 | |
| Previous Owner | Centerbank | $50,000 |
Source: Public Records
Tax History Compared to Growth
Tax History
| Year | Tax Paid | Tax Assessment Tax Assessment Total Assessment is a certain percentage of the fair market value that is determined by local assessors to be the total taxable value of land and additions on the property. | Land | Improvement |
|---|---|---|---|---|
| 2025 | $7,496 | $190,260 | $32,970 | $157,290 |
| 2024 | $7,325 | $190,260 | $32,970 | $157,290 |
| 2023 | $7,078 | $190,260 | $32,970 | $157,290 |
| 2022 | $7,563 | $190,260 | $32,970 | $157,290 |
| 2021 | $5,050 | $115,080 | $26,390 | $88,690 |
| 2020 | $5,050 | $115,080 | $26,390 | $88,690 |
| 2019 | $4,946 | $115,080 | $26,390 | $88,690 |
| 2018 | $4,946 | $115,080 | $26,390 | $88,690 |
| 2017 | $4,451 | $115,080 | $26,390 | $88,690 |
| 2016 | $4,086 | $98,350 | $11,690 | $86,660 |
| 2015 | $4,086 | $98,350 | $11,690 | $86,660 |
| 2014 | $4,086 | $98,350 | $11,690 | $86,660 |
Source: Public Records
Map
Nearby Homes