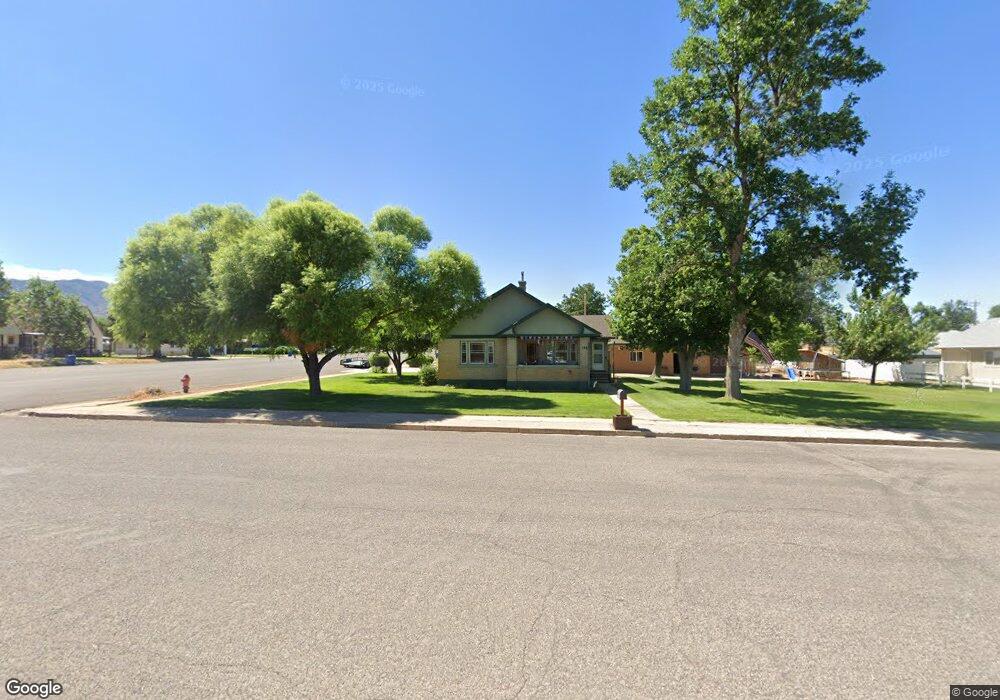
90 E Center St Fillmore, UT 84631
Estimated Value: $320,000 - $375,000
4
Beds
1
Bath
2,080
Sq Ft
$162/Sq Ft
Est. Value
About This Home
This home is located at 90 E Center St, Fillmore, UT 84631 and is currently estimated at $337,982, approximately $162 per square foot. 90 E Center St is a home located in Millard County.
Ownership History
Date
Name
Owned For
Owner Type
Purchase Details
Closed on
Oct 24, 2019
Sold by
Jenkins Scott Smith
Bought by
Tracy Kevin E
Current Estimated Value
Purchase Details
Closed on
Jul 14, 2011
Sold by
Mcnatt Lisa D and Hollis Mcnatt R
Bought by
Jenkins Scott Smith
Home Financials for this Owner
Home Financials are based on the most recent Mortgage that was taken out on this home.
Original Mortgage
$131,577
Interest Rate
3.87%
Mortgage Type
FHA
Purchase Details
Closed on
Jul 26, 2010
Sold by
Mcnatt Lisa and Lucksinger Steven A
Bought by
Mcnatt Lisa D and Hollis Mcnatt R
Purchase Details
Closed on
Oct 20, 2006
Sold by
Tingey Nathan V and Tingey Charity
Bought by
Lucksinger Steve A
Create a Home Valuation Report for This Property
The Home Valuation Report is an in-depth analysis detailing your home's value as well as a comparison with similar homes in the area
Home Values in the Area
Average Home Value in this Area
Purchase History
| Date | Buyer | Sale Price | Title Company |
|---|---|---|---|
| Tracy Kevin E | -- | None Available | |
| Jenkins Scott Smith | -- | -- | |
| Mcnatt Lisa D | -- | -- | |
| Lucksinger Steve A | -- | -- |
Source: Public Records
Mortgage History
| Date | Status | Borrower | Loan Amount |
|---|---|---|---|
| Previous Owner | Jenkins Scott Smith | $131,577 |
Source: Public Records
Tax History
| Year | Tax Paid | Tax Assessment Tax Assessment Total Assessment is a certain percentage of the fair market value that is determined by local assessors to be the total taxable value of land and additions on the property. | Land | Improvement |
|---|---|---|---|---|
| 2025 | $1,505 | $189,051 | $26,917 | $162,134 |
| 2024 | $1,505 | $140,909 | $21,215 | $119,694 |
| 2023 | $1,542 | $140,909 | $21,215 | $119,694 |
| 2022 | $1,365 | $122,531 | $19,286 | $103,245 |
| 2021 | $1,200 | $103,478 | $12,524 | $90,954 |
| 2020 | $1,112 | $96,439 | $11,385 | $85,054 |
| 2019 | $918 | $79,892 | $11,385 | $68,507 |
| 2018 | $876 | $77,960 | $11,385 | $66,575 |
| 2017 | $732 | $61,922 | $10,890 | $51,032 |
| 2016 | $700 | $61,922 | $10,890 | $51,032 |
| 2015 | $700 | $61,922 | $10,890 | $51,032 |
| 2014 | -- | $61,922 | $10,890 | $51,032 |
| 2013 | -- | $61,922 | $10,890 | $51,032 |
Source: Public Records
Map
Nearby Homes
- 40 S 100 Rd E
- 75 N 100 West St
- 155 W Center St
- 220 S 200 E
- 235 S 200 St E
- 225 W 200 St N
- 260 W 200 S
- 351 W 100 South St
- 390 N 100 W
- 245 W 300 N
- 465 S 100 W
- 155 E 500 St S
- 157 E 500 South St
- 405 E 500 St S
- 335 W 400 North St
- 310 S 500 West Rd
- 690 E 500 S
- 760 E 700 St S
- 750 800 South Fillmore
- 825 800 South Fillmore
Your Personal Tour Guide
Ask me questions while you tour the home.