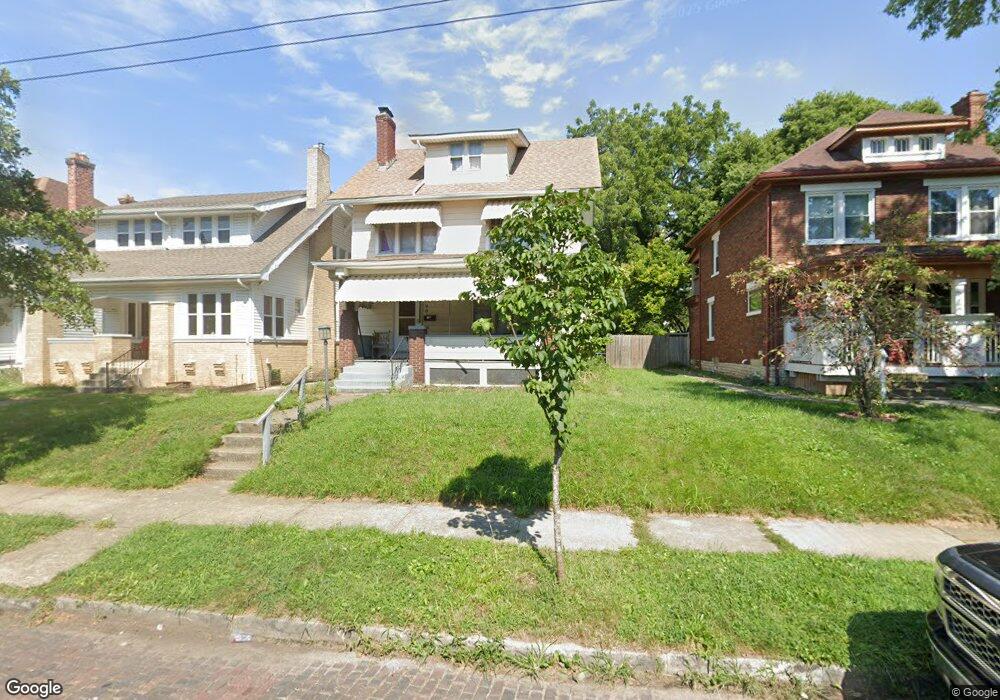
90 Eldon Ave Columbus, OH 43204
North Hilltop NeighborhoodEstimated Value: $189,948 - $197,000
3
Beds
2
Baths
2,080
Sq Ft
$93/Sq Ft
Est. Value
About This Home
This home is located at 90 Eldon Ave, Columbus, OH 43204 and is currently estimated at $194,237, approximately $93 per square foot. 90 Eldon Ave is a home located in Franklin County with nearby schools including West Broad Elementary School, Westmoor Middle School, and West High School.
Ownership History
Date
Name
Owned For
Owner Type
Purchase Details
Closed on
Mar 16, 2007
Sold by
Deutsche Bank National Trust Co
Bought by
Edwards Investment Group Llc
Current Estimated Value
Purchase Details
Closed on
Oct 30, 2006
Sold by
Payne Edward T and Case #06Cve04 4658
Bought by
Deutsche Bank National Trust Co and Long Beach Mortgage Loan Trust 2002-4
Purchase Details
Closed on
Aug 1, 2002
Sold by
Taylor Sandra L and Taylor Paul E
Bought by
Payne Edward T
Home Financials for this Owner
Home Financials are based on the most recent Mortgage that was taken out on this home.
Original Mortgage
$64,000
Interest Rate
9.95%
Purchase Details
Closed on
Jun 14, 2000
Sold by
Estate Of Arma M Oneil
Bought by
Taylor Sandra L and Smith Patricia A
Purchase Details
Closed on
May 19, 2000
Sold by
Smith Patricia A and Smith Richard A
Bought by
Taylor Sandra L and Taylor Paul E
Purchase Details
Closed on
Jul 10, 1978
Bought by
Oneil Arma M
Create a Home Valuation Report for This Property
The Home Valuation Report is an in-depth analysis detailing your home's value as well as a comparison with similar homes in the area
Home Values in the Area
Average Home Value in this Area
Purchase History
| Date | Buyer | Sale Price | Title Company |
|---|---|---|---|
| Edwards Investment Group Llc | $30,000 | Sourceti | |
| Deutsche Bank National Trust Co | $48,000 | None Available | |
| Payne Edward T | $80,000 | Chelsea Title Agency | |
| Taylor Sandra L | -- | -- | |
| Taylor Sandra L | $25,000 | -- | |
| Oneil Arma M | -- | -- |
Source: Public Records
Mortgage History
| Date | Status | Borrower | Loan Amount |
|---|---|---|---|
| Previous Owner | Payne Edward T | $64,000 | |
| Closed | Payne Edward T | $16,000 |
Source: Public Records
Tax History
| Year | Tax Paid | Tax Assessment Tax Assessment Total Assessment is a certain percentage of the fair market value that is determined by local assessors to be the total taxable value of land and additions on the property. | Land | Improvement |
|---|---|---|---|---|
| 2025 | $2,349 | $51,250 | $6,060 | $45,190 |
| 2024 | $2,349 | $51,250 | $6,060 | $45,190 |
| 2023 | $4,287 | $51,240 | $6,055 | $45,185 |
| 2022 | $1,520 | $28,600 | $2,240 | $26,360 |
| 2021 | $1,523 | $28,600 | $2,240 | $26,360 |
| 2020 | $1,525 | $28,600 | $2,240 | $26,360 |
| 2019 | $1,437 | $23,110 | $1,860 | $21,250 |
| 2018 | $1,736 | $23,110 | $1,860 | $21,250 |
| 2017 | $1,437 | $23,110 | $1,860 | $21,250 |
| 2016 | $1,703 | $25,070 | $5,850 | $19,220 |
| 2015 | $1,551 | $25,070 | $5,850 | $19,220 |
| 2014 | $1,554 | $25,070 | $5,850 | $19,220 |
| 2013 | $767 | $25,060 | $5,845 | $19,215 |
Source: Public Records
Map
Nearby Homes
- 120 N Eureka Ave Unit 122
- 75 N Terrace Ave
- 78 N Burgess Ave
- 27 S Oakley Ave
- 110 N Ogden Ave
- 38 S Burgess Ave
- 210 N Oakley Ave
- 261 N Wayne Ave
- 95 S Eureka Ave
- 285 N Wayne Ave
- 106 S Richardson Ave Unit 108
- 90 S Burgess Ave
- 121 N Terrace Ave
- 51 S Ogden Ave Unit 51H
- 66 S Wheatland Ave
- 281 N Burgess Ave
- 151 S Eureka Ave
- 151 S Wayne Ave Unit 153
- 126 S Oakley Ave
- 200-202 N Harris Ave
- 94 Eldon Ave
- 84 Eldon Ave
- 80 Eldon Ave
- 106 Eldon Ave
- 72 Eldon Ave
- 93 N Eureka Ave
- 99 N Eureka Ave
- 68 Eldon Ave
- 101 N Eureka Ave Unit 103
- 101-103 N Eureka Ave
- 107 N Eureka Ave
- 75 N Eureka Ave Unit 77
- 64 Eldon Ave
- 89 Eldon Ave
- 83 Eldon Ave
- 93 Eldon Ave
- 101 Eldon Ave
- 77 Eldon Ave
- 73 N Eureka Ave
- 73 N Eureka Ave
Your Personal Tour Guide
Ask me questions while you tour the home.