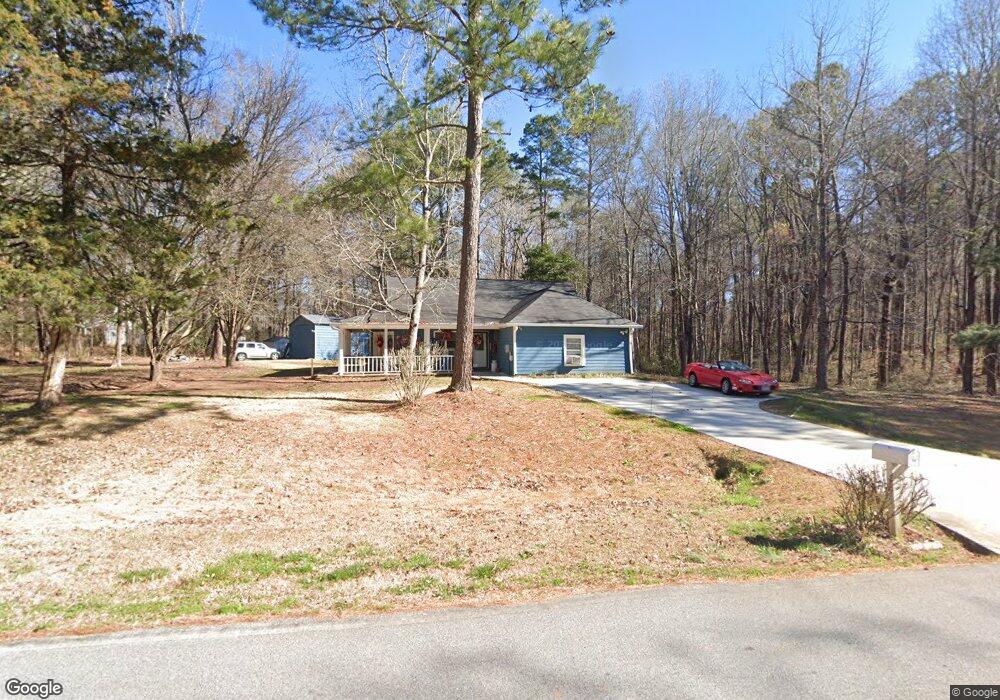
90 Holly Creek Dr Covington, GA 30016
Estimated Value: $233,262 - $266,000
--
Bed
2
Baths
1,515
Sq Ft
$164/Sq Ft
Est. Value
About This Home
This home is located at 90 Holly Creek Dr, Covington, GA 30016 and is currently estimated at $248,316, approximately $163 per square foot. 90 Holly Creek Dr is a home located in Newton County with nearby schools including Livingston Elementary School, Liberty Middle School, and Alcovy High School.
Ownership History
Date
Name
Owned For
Owner Type
Purchase Details
Closed on
Aug 7, 2013
Sold by
Campbell Rebecca A
Bought by
Streiker Rebecca A
Current Estimated Value
Home Financials for this Owner
Home Financials are based on the most recent Mortgage that was taken out on this home.
Original Mortgage
$85,144
Outstanding Balance
$63,895
Interest Rate
4.62%
Mortgage Type
FHA
Estimated Equity
$184,421
Purchase Details
Closed on
Jul 30, 2003
Sold by
Dailey Troy R
Bought by
Campbell Rebecca A
Home Financials for this Owner
Home Financials are based on the most recent Mortgage that was taken out on this home.
Original Mortgage
$104,583
Interest Rate
5.17%
Mortgage Type
FHA
Purchase Details
Closed on
Feb 4, 2003
Sold by
Gladden Mark E
Bought by
Dailey Troy
Purchase Details
Closed on
May 24, 1996
Sold by
Gladden Mark Angela
Bought by
Johnson Michael
Create a Home Valuation Report for This Property
The Home Valuation Report is an in-depth analysis detailing your home's value as well as a comparison with similar homes in the area
Home Values in the Area
Average Home Value in this Area
Purchase History
| Date | Buyer | Sale Price | Title Company |
|---|---|---|---|
| Streiker Rebecca A | -- | -- | |
| Campbell Rebecca A | $106,300 | -- | |
| Dailey Troy | $72,000 | -- | |
| Johnson Michael | $12,700 | -- |
Source: Public Records
Mortgage History
| Date | Status | Borrower | Loan Amount |
|---|---|---|---|
| Open | Streiker Rebecca A | $85,144 | |
| Previous Owner | Campbell Rebecca A | $104,583 | |
| Closed | Johnson Michael | $0 |
Source: Public Records
Tax History Compared to Growth
Tax History
| Year | Tax Paid | Tax Assessment Tax Assessment Total Assessment is a certain percentage of the fair market value that is determined by local assessors to be the total taxable value of land and additions on the property. | Land | Improvement |
|---|---|---|---|---|
| 2024 | $2,733 | $106,440 | $14,800 | $91,640 |
| 2023 | $2,676 | $97,240 | $10,000 | $87,240 |
| 2022 | $2,050 | $74,200 | $10,000 | $64,200 |
| 2021 | $1,785 | $57,640 | $8,800 | $48,840 |
| 2020 | $1,733 | $50,560 | $7,200 | $43,360 |
| 2019 | $1,657 | $47,560 | $7,200 | $40,360 |
| 2018 | $1,319 | $37,400 | $7,200 | $30,200 |
| 2017 | $1,151 | $32,520 | $6,000 | $26,520 |
| 2016 | $1,049 | $29,560 | $3,800 | $25,760 |
| 2015 | $825 | $22,960 | $3,200 | $19,760 |
| 2014 | $823 | $22,960 | $0 | $0 |
Source: Public Records
Map
Nearby Homes
- 270 Wellbrook Dr
- 30 Laurel Way
- 230 Laurel Way
- 0 Highway 81 S Unit 7670352
- 35 Green Hill Ct
- 115 Arthurs Ln
- 66 Ellis Trail
- 335 Glen Echo Dr
- 455 Bethany Rd
- 160 Cross Rd
- 15 Granville Ln
- 15 Glen Echo Dr
- 624 Bethany Rd
- The Northview Plan at Hampton Place Estates
- The Carrollton Plan at Hampton Place Estates
- The Wendell Plan at Hampton Place Estates
- The Donovan Plan at Hampton Place Estates
- The Kendall Plan at Hampton Place Estates
- The Rosewood Plan at Hampton Place Estates
- The Brookdale Plan at Hampton Place Estates
- 45 Willow Shoals Dr
- 25 Willow Shoals Dr
- 80 Holly Creek Dr
- 85 Holly Creek Dr
- 30 Willow Shoals Dr Unit 88
- 30 Willow Shoals Dr
- 55 Willow Shoals Dr
- 50 Willow Shoals Dr
- 75 Holly Creek Dr
- 70 Holly Creek Dr
- 15 Willow Shoals Dr
- 65 Laurel Way
- 20 Willow Shoals Dr
- 65 Willow Shoals Dr
- 55 Laurel Way
- 70 Willow Shoals Dr
- 65 Holly Creek Dr
- 60 Holly Creek Dr
- 105 Laurel Way
- 75 Willow Shoals Dr