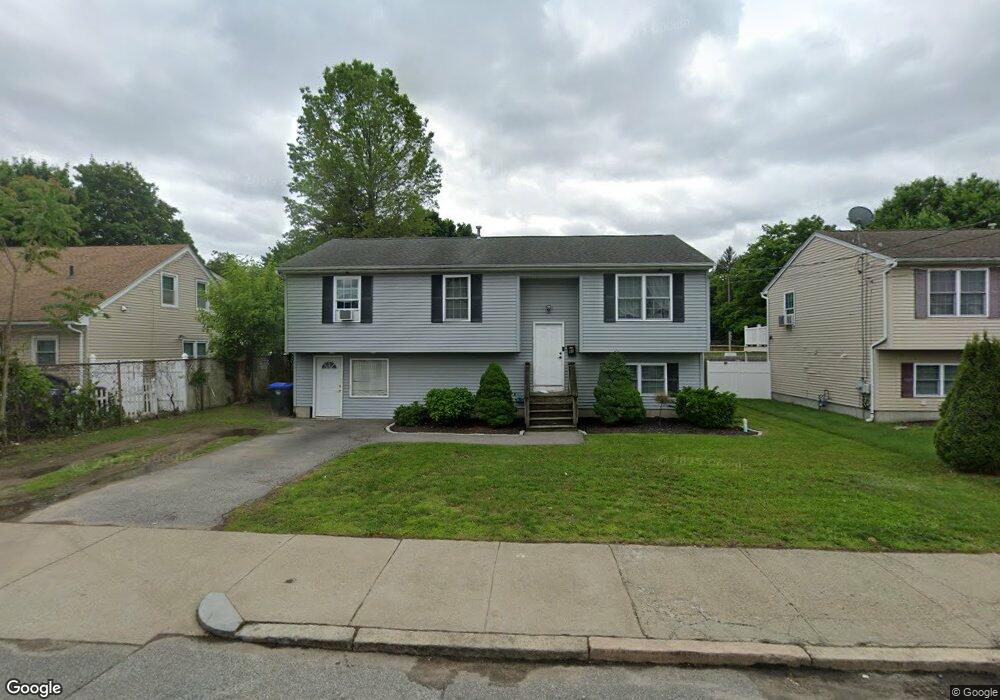
90 Killingly St Providence, RI 02909
Silver Lake NeighborhoodEstimated Value: $376,000 - $411,000
3
Beds
2
Baths
1,600
Sq Ft
$249/Sq Ft
Est. Value
About This Home
This home is located at 90 Killingly St, Providence, RI 02909 and is currently estimated at $399,087, approximately $249 per square foot. 90 Killingly St is a home located in Providence County with nearby schools including Achievement First Promesa, Achievement First Providence Mayoral Academy Elementary School, and Achievement First Providence Mayoral Academy Elementary.
Ownership History
Date
Name
Owned For
Owner Type
Purchase Details
Closed on
May 19, 2017
Sold by
Delrosario Christian and Delorsario Bernardina
Bought by
Delrosario Christian and Delrosario Bernardina
Current Estimated Value
Home Financials for this Owner
Home Financials are based on the most recent Mortgage that was taken out on this home.
Original Mortgage
$162,011
Outstanding Balance
$132,215
Interest Rate
3.87%
Mortgage Type
FHA
Estimated Equity
$266,872
Purchase Details
Closed on
May 5, 2017
Sold by
Perrotti-Johns Lori L
Bought by
Delrosario Christian and Delrosarrio Bernandina
Home Financials for this Owner
Home Financials are based on the most recent Mortgage that was taken out on this home.
Original Mortgage
$162,011
Outstanding Balance
$132,215
Interest Rate
3.87%
Mortgage Type
FHA
Estimated Equity
$266,872
Create a Home Valuation Report for This Property
The Home Valuation Report is an in-depth analysis detailing your home's value as well as a comparison with similar homes in the area
Home Values in the Area
Average Home Value in this Area
Purchase History
| Date | Buyer | Sale Price | Title Company |
|---|---|---|---|
| Delrosario Christian | -- | -- | |
| Delrosario Christian | $165,000 | -- |
Source: Public Records
Mortgage History
| Date | Status | Borrower | Loan Amount |
|---|---|---|---|
| Open | Delrosario Christian | $162,011 |
Source: Public Records
Tax History
| Year | Tax Paid | Tax Assessment Tax Assessment Total Assessment is a certain percentage of the fair market value that is determined by local assessors to be the total taxable value of land and additions on the property. | Land | Improvement |
|---|---|---|---|---|
| 2025 | $2,979 | $354,600 | $139,700 | $214,900 |
| 2024 | $4,852 | $264,400 | $88,300 | $176,100 |
| 2023 | $4,852 | $264,400 | $88,300 | $176,100 |
| 2022 | $4,706 | $264,400 | $88,300 | $176,100 |
| 2021 | $5,457 | $222,200 | $53,100 | $169,100 |
| 2020 | $5,457 | $222,200 | $53,100 | $169,100 |
| 2019 | $5,457 | $222,200 | $53,100 | $169,100 |
| 2018 | $5,200 | $162,700 | $45,200 | $117,500 |
| 2017 | $5,200 | $162,700 | $45,200 | $117,500 |
| 2016 | $5,200 | $162,700 | $45,200 | $117,500 |
| 2015 | $4,631 | $139,900 | $45,200 | $94,700 |
| 2014 | $4,722 | $139,900 | $45,200 | $94,700 |
| 2013 | $4,722 | $139,900 | $45,200 | $94,700 |
Source: Public Records
Map
Nearby Homes
- 665 Plainfield St
- 166 Lowell Ave
- 231 Lowell Ave
- 240 Eastwood Ave
- 60 Ophelia St
- 162 Merino St
- 0 Central Ave Unit 1406483
- 140 Cleveland St
- 68 Murray St
- 10 Mott St
- 15 Melissa St
- 173 Whittier Ave
- 649 Union Ave
- 76 Moorefield St
- 102 Ophelia St
- 29 Matson Ave Unit 35
- 27 Moorefield St
- 36 Moorefield St Unit 38
- 620 Union Ave
- 0 Orchard St Unit 1396400
Your Personal Tour Guide
Ask me questions while you tour the home.