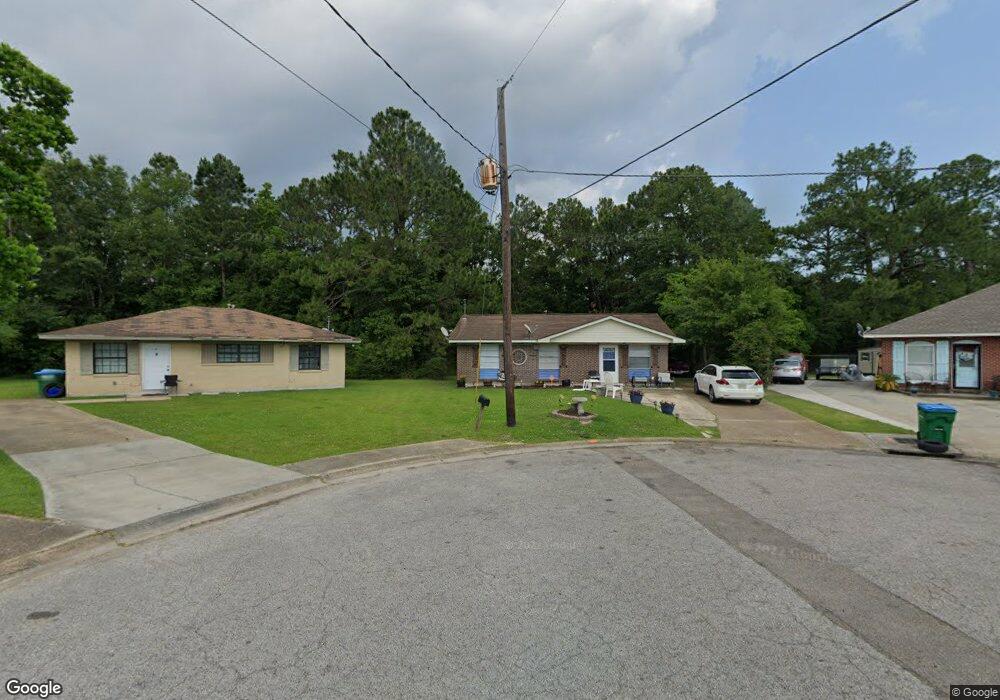
90 Maple Ct Gulfport, MS 39501
North Gulfport NeighborhoodEstimated Value: $88,000 - $95,553
3
Beds
1
Bath
1,100
Sq Ft
$83/Sq Ft
Est. Value
About This Home
This home is located at 90 Maple Ct, Gulfport, MS 39501 and is currently estimated at $91,388, approximately $83 per square foot. 90 Maple Ct is a home located in Harrison County with nearby schools including Harrison Central Elementary School, Orange Grove Elementary School, and West Harrison High School.
Ownership History
Date
Name
Owned For
Owner Type
Purchase Details
Closed on
Feb 7, 2020
Sold by
Kennedy Anthony R
Bought by
Signature Gulf Coast Properties Llc
Current Estimated Value
Home Financials for this Owner
Home Financials are based on the most recent Mortgage that was taken out on this home.
Original Mortgage
$37,563
Interest Rate
3.6%
Mortgage Type
Commercial
Purchase Details
Closed on
Jan 21, 2020
Sold by
Kennedy Charitee O
Bought by
Kennedy Anthony R
Home Financials for this Owner
Home Financials are based on the most recent Mortgage that was taken out on this home.
Original Mortgage
$37,563
Interest Rate
3.6%
Mortgage Type
Commercial
Purchase Details
Closed on
Nov 14, 2019
Sold by
Kennedy Anthony and Guillory Charitee
Bought by
Kennedy Anthony
Purchase Details
Closed on
Mar 15, 2012
Sold by
Kennedy Anthony R
Bought by
Kennedy Anthony R and Kennedy Guillory Charitee O
Create a Home Valuation Report for This Property
The Home Valuation Report is an in-depth analysis detailing your home's value as well as a comparison with similar homes in the area
Home Values in the Area
Average Home Value in this Area
Purchase History
| Date | Buyer | Sale Price | Title Company |
|---|---|---|---|
| Signature Gulf Coast Properties Llc | -- | None Available | |
| Kennedy Anthony R | -- | None Available | |
| Kennedy Anthony | -- | None Available | |
| Kennedy Anthony R | -- | -- |
Source: Public Records
Mortgage History
| Date | Status | Borrower | Loan Amount |
|---|---|---|---|
| Closed | Signature Gulf Coast Properties Llc | $37,563 |
Source: Public Records
Tax History Compared to Growth
Tax History
| Year | Tax Paid | Tax Assessment Tax Assessment Total Assessment is a certain percentage of the fair market value that is determined by local assessors to be the total taxable value of land and additions on the property. | Land | Improvement |
|---|---|---|---|---|
| 2024 | $866 | $7,275 | $0 | $0 |
| 2023 | $870 | $7,275 | $0 | $0 |
| 2022 | $875 | $7,275 | $0 | $0 |
| 2021 | $878 | $7,275 | $0 | $0 |
| 2020 | $882 | $7,076 | $0 | $0 |
| 2019 | $887 | $7,076 | $0 | $0 |
| 2018 | $894 | $7,076 | $0 | $0 |
| 2017 | $894 | $7,076 | $0 | $0 |
| 2015 | $949 | $7,387 | $0 | $0 |
| 2014 | -- | $8,537 | $0 | $0 |
| 2013 | -- | $7,387 | $1,725 | $5,662 |
Source: Public Records
Map
Nearby Homes
- 98 Russell Blvd
- 79 Holly Cir
- 0 Evans St
- 0 Ohio Ave Unit 4120328
- 0 Louisiana Ave Unit 4117356
- 15030 Polk St
- 15130 Highway 49
- 0 Turkey Creek Dr Unit 4123525
- 8328 S Carolina Ave
- 15104 Monroe St
- 123 Michigan Ave
- 4410+8150 Michigan Ave
- 8153 34th Ave
- 8404 U S 49
- 0 Rio Grande St
- 3605 Ganges St
- 0 Florida Ave Unit 4072675
- 0 18th Ave
- 0 I-10 Unit 4085709
- 4620 Redstart Dr