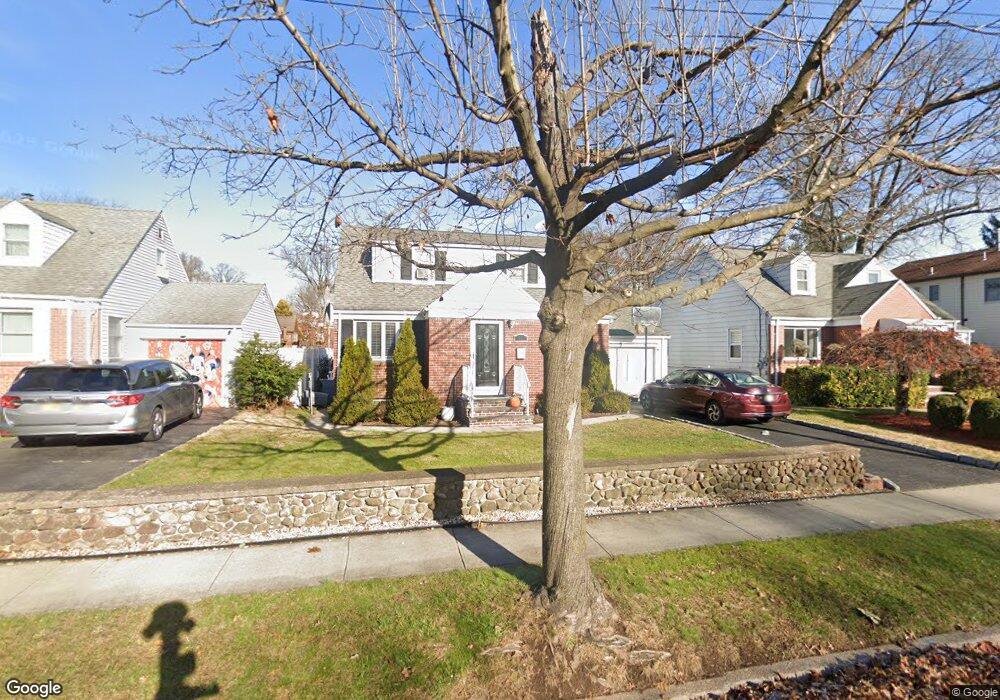
90 Maple St Dumont, NJ 07628
Estimated Value: $523,000 - $614,000
--
Bed
--
Bath
1,326
Sq Ft
$436/Sq Ft
Est. Value
About This Home
This home is located at 90 Maple St, Dumont, NJ 07628 and is currently estimated at $578,543, approximately $436 per square foot. 90 Maple St is a home located in Bergen County with nearby schools including Dumont High School.
Ownership History
Date
Name
Owned For
Owner Type
Purchase Details
Closed on
Aug 2, 2016
Sold by
Gleason Wesley and Gleason Carissa
Bought by
Funez Moises and Funez Paola Peralta
Current Estimated Value
Home Financials for this Owner
Home Financials are based on the most recent Mortgage that was taken out on this home.
Original Mortgage
$332,500
Interest Rate
4.3%
Mortgage Type
New Conventional
Purchase Details
Closed on
Mar 20, 2012
Sold by
Horni Chrostopher and Smith Lauren
Bought by
Gleason Wesley and Gleason Carissa
Home Financials for this Owner
Home Financials are based on the most recent Mortgage that was taken out on this home.
Original Mortgage
$326,880
Interest Rate
3.95%
Mortgage Type
VA
Purchase Details
Closed on
Oct 24, 2008
Sold by
Joyce Tim and Joyce Katherine
Bought by
Horni Christopher and Smith Lauren
Home Financials for this Owner
Home Financials are based on the most recent Mortgage that was taken out on this home.
Original Mortgage
$336,656
Interest Rate
6.08%
Mortgage Type
Purchase Money Mortgage
Create a Home Valuation Report for This Property
The Home Valuation Report is an in-depth analysis detailing your home's value as well as a comparison with similar homes in the area
Home Values in the Area
Average Home Value in this Area
Purchase History
| Date | Buyer | Sale Price | Title Company |
|---|---|---|---|
| Funez Moises | $350,000 | Fidelity National Title | |
| Gleason Wesley | $320,000 | -- | |
| Horni Christopher | $350,000 | -- |
Source: Public Records
Mortgage History
| Date | Status | Borrower | Loan Amount |
|---|---|---|---|
| Previous Owner | Funez Moises | $332,500 | |
| Previous Owner | Gleason Wesley | $326,880 | |
| Previous Owner | Horni Christopher | $336,656 |
Source: Public Records
Tax History Compared to Growth
Tax History
| Year | Tax Paid | Tax Assessment Tax Assessment Total Assessment is a certain percentage of the fair market value that is determined by local assessors to be the total taxable value of land and additions on the property. | Land | Improvement |
|---|---|---|---|---|
| 2025 | $10,752 | $604,000 | $280,000 | $324,000 |
| 2024 | $10,487 | $264,500 | $150,000 | $114,500 |
| 2023 | $10,271 | $264,500 | $150,000 | $114,500 |
| 2022 | $10,271 | $264,500 | $150,000 | $114,500 |
| 2021 | $10,220 | $264,500 | $150,000 | $114,500 |
| 2020 | $9,943 | $264,500 | $150,000 | $114,500 |
| 2019 | $9,705 | $264,500 | $150,000 | $114,500 |
| 2018 | $9,506 | $264,500 | $150,000 | $114,500 |
| 2017 | $9,324 | $264,500 | $150,000 | $114,500 |
| 2016 | $9,107 | $264,500 | $150,000 | $114,500 |
| 2015 | $8,898 | $264,500 | $150,000 | $114,500 |
| 2014 | $8,723 | $264,500 | $150,000 | $114,500 |
Source: Public Records
Map
Nearby Homes
- 136 Elm St
- 23 Cherry Ct
- 203 New York Ave
- 139 Stonegate Trail
- 181 Phelps Ave
- 280 Hickory Ave
- 40 Depew St
- 35 Wolcott Rd
- 48 Colonial Pkwy
- 12 Spruce St
- 79 Blauvelt Ave
- 41 Monument Place
- 17 Jefferson Ave
- 61 Jefferson Ave
- 20 Dojean Ct
- 254 Concord St
- 44 Bogert Place
- 305 E Main St
- 118 Sunset Ln
- 17 Wight Place