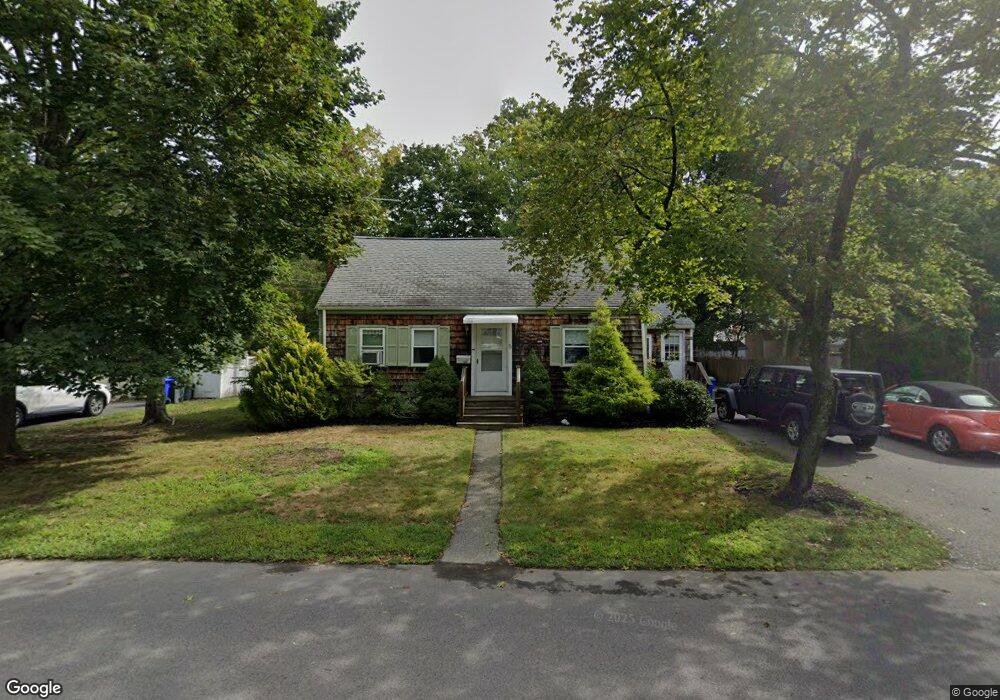
90 Moncrief Rd Rockland, MA 02370
Estimated Value: $528,000 - $601,000
3
Beds
2
Baths
1,344
Sq Ft
$412/Sq Ft
Est. Value
About This Home
This home is located at 90 Moncrief Rd, Rockland, MA 02370 and is currently estimated at $553,075, approximately $411 per square foot. 90 Moncrief Rd is a home located in Plymouth County with nearby schools including Rockland Senior High School, Calvary Chapel Academy, and Holy Family Elementary School.
Ownership History
Date
Name
Owned For
Owner Type
Purchase Details
Closed on
Mar 28, 2024
Sold by
Sheffield Richard E Est and Sheffield-Bono
Bought by
Sheffield -Bono Elaine and Keegan Laura S
Current Estimated Value
Purchase Details
Closed on
Jan 23, 2003
Sold by
Oneil Mary M
Bought by
Goode Brian C and Goode Cathleen M
Home Financials for this Owner
Home Financials are based on the most recent Mortgage that was taken out on this home.
Original Mortgage
$232,750
Interest Rate
6.11%
Mortgage Type
Purchase Money Mortgage
Create a Home Valuation Report for This Property
The Home Valuation Report is an in-depth analysis detailing your home's value as well as a comparison with similar homes in the area
Home Values in the Area
Average Home Value in this Area
Purchase History
| Date | Buyer | Sale Price | Title Company |
|---|---|---|---|
| Sheffield -Bono Elaine | -- | None Available | |
| Sheffield-Bono Elaine | -- | None Available | |
| Sheffield -Bono Elaine | -- | None Available | |
| Goode Brian C | $245,000 | -- | |
| Goode Brian C | $245,000 | -- |
Source: Public Records
Mortgage History
| Date | Status | Borrower | Loan Amount |
|---|---|---|---|
| Previous Owner | Goode Brian C | $232,750 |
Source: Public Records
Tax History
| Year | Tax Paid | Tax Assessment Tax Assessment Total Assessment is a certain percentage of the fair market value that is determined by local assessors to be the total taxable value of land and additions on the property. | Land | Improvement |
|---|---|---|---|---|
| 2025 | $6,169 | $451,300 | $224,400 | $226,900 |
| 2024 | $5,988 | $425,900 | $211,700 | $214,200 |
| 2023 | $5,951 | $391,000 | $194,200 | $196,800 |
| 2022 | $5,700 | $340,300 | $168,800 | $171,500 |
| 2021 | $3,481 | $309,900 | $153,500 | $156,400 |
| 2020 | $5,168 | $295,300 | $146,200 | $149,100 |
| 2019 | $5,044 | $281,500 | $139,300 | $142,200 |
| 2018 | $4,774 | $262,000 | $139,300 | $122,700 |
| 2017 | $4,638 | $251,000 | $139,300 | $111,700 |
| 2016 | $4,463 | $241,400 | $133,900 | $107,500 |
| 2015 | $4,244 | $223,000 | $125,200 | $97,800 |
| 2014 | $3,989 | $217,500 | $122,700 | $94,800 |
Source: Public Records
Map
Nearby Homes
- 9 Old Market St
- 823 Market St
- 117 Liberty St
- 696 Summer St
- 5 Pat Rose Way
- 215 Market St
- 643 Summer St
- 810 Brookline Way
- 186 Vernon St
- 41 Winter Cir
- 15 Bradford St
- 50 Linden Park
- 63 Webster St
- 225 W Water St
- 191 Summer St
- 103 Grove St Unit 349
- 119 Grove St Unit 234
- 0 W Water St
- 135 Grove St Unit 123
- 135 Grove St Unit 115
Your Personal Tour Guide
Ask me questions while you tour the home.