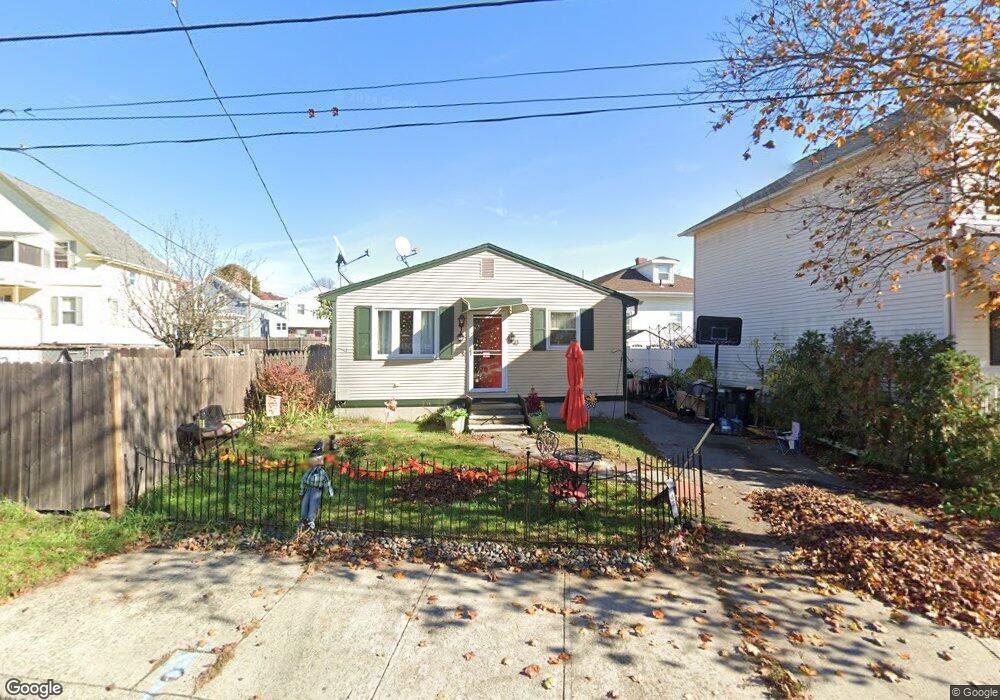
90 Opper St Providence, RI 02904
Charles NeighborhoodEstimated Value: $379,000 - $380,000
3
Beds
3
Baths
960
Sq Ft
$395/Sq Ft
Est. Value
About This Home
This home is located at 90 Opper St, Providence, RI 02904 and is currently estimated at $379,454, approximately $395 per square foot. 90 Opper St is a home located in Providence County with nearby schools including Times Squared Academy, Times2 Elementary School, and Times2 Middle/High School.
Ownership History
Date
Name
Owned For
Owner Type
Purchase Details
Closed on
May 6, 2003
Sold by
Affliated Rlty Network
Bought by
Ashe Thomas F
Current Estimated Value
Home Financials for this Owner
Home Financials are based on the most recent Mortgage that was taken out on this home.
Original Mortgage
$122,000
Interest Rate
5.82%
Create a Home Valuation Report for This Property
The Home Valuation Report is an in-depth analysis detailing your home's value as well as a comparison with similar homes in the area
Home Values in the Area
Average Home Value in this Area
Purchase History
| Date | Buyer | Sale Price | Title Company |
|---|---|---|---|
| Ashe Thomas F | $152,500 | -- |
Source: Public Records
Mortgage History
| Date | Status | Borrower | Loan Amount |
|---|---|---|---|
| Open | Ashe Thomas F | $184,000 | |
| Closed | Ashe Thomas F | $46,000 | |
| Closed | Ashe Thomas F | $122,000 |
Source: Public Records
Tax History
| Year | Tax Paid | Tax Assessment Tax Assessment Total Assessment is a certain percentage of the fair market value that is determined by local assessors to be the total taxable value of land and additions on the property. | Land | Improvement |
|---|---|---|---|---|
| 2025 | $4,773 | $326,900 | $129,400 | $197,500 |
| 2024 | $4,714 | $256,900 | $84,900 | $172,000 |
| 2023 | $4,714 | $256,900 | $84,900 | $172,000 |
| 2022 | $4,573 | $256,900 | $84,900 | $172,000 |
| 2021 | $4,163 | $169,500 | $63,800 | $105,700 |
| 2020 | $4,163 | $169,500 | $63,800 | $105,700 |
| 2019 | $4,163 | $169,500 | $63,800 | $105,700 |
| 2018 | $3,736 | $116,900 | $49,300 | $67,600 |
| 2017 | $3,736 | $116,900 | $49,300 | $67,600 |
| 2016 | $3,736 | $116,900 | $49,300 | $67,600 |
| 2015 | $3,691 | $111,500 | $49,900 | $61,600 |
| 2014 | $3,763 | $111,500 | $49,900 | $61,600 |
| 2013 | -- | $111,500 | $49,900 | $61,600 |
Source: Public Records
Map
Nearby Homes
Your Personal Tour Guide
Ask me questions while you tour the home.