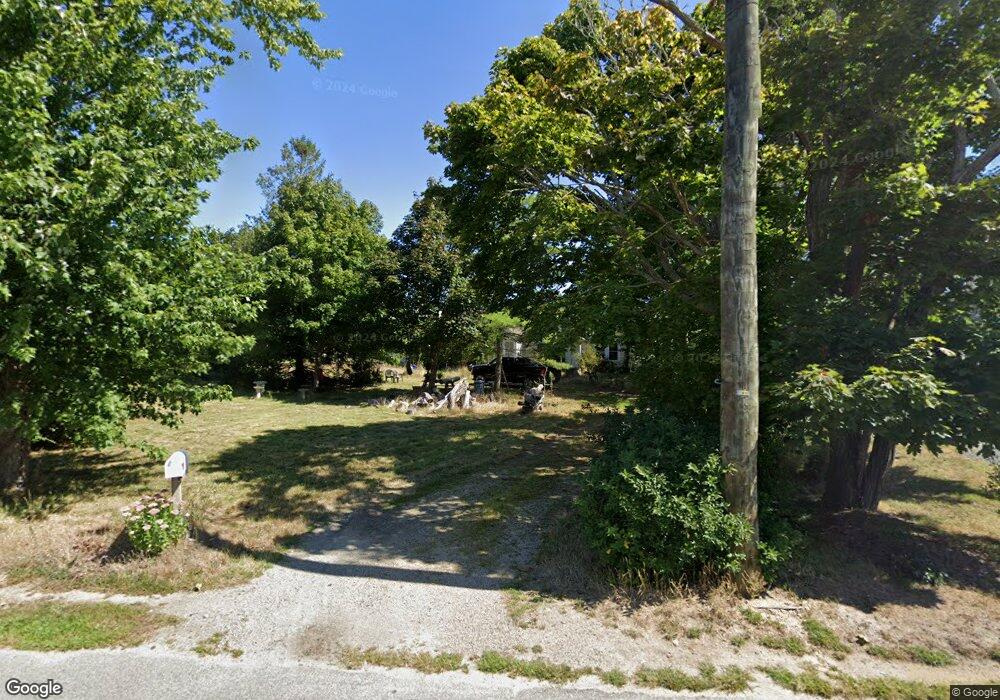
90 Pleasant St Dennis Port, MA 02639
Dennis Port NeighborhoodEstimated Value: $731,000 - $967,723
2
Beds
2
Baths
2,280
Sq Ft
$360/Sq Ft
Est. Value
About This Home
This home is located at 90 Pleasant St, Dennis Port, MA 02639 and is currently estimated at $820,931, approximately $360 per square foot. 90 Pleasant St is a home located in Barnstable County with nearby schools including Dennis-Yarmouth Regional High School and St. Pius X. School.
Ownership History
Date
Name
Owned For
Owner Type
Purchase Details
Closed on
Aug 4, 2004
Sold by
Kerr John S and Kerr Sarah T
Bought by
Kerr John T and Rogers Margaret K
Current Estimated Value
Home Financials for this Owner
Home Financials are based on the most recent Mortgage that was taken out on this home.
Original Mortgage
$303,000
Outstanding Balance
$151,175
Interest Rate
6.2%
Mortgage Type
Purchase Money Mortgage
Estimated Equity
$669,756
Create a Home Valuation Report for This Property
The Home Valuation Report is an in-depth analysis detailing your home's value as well as a comparison with similar homes in the area
Home Values in the Area
Average Home Value in this Area
Purchase History
| Date | Buyer | Sale Price | Title Company |
|---|---|---|---|
| Kerr John T | -- | -- | |
| Kerr John S | -- | -- |
Source: Public Records
Mortgage History
| Date | Status | Borrower | Loan Amount |
|---|---|---|---|
| Open | Kerr John S | $303,000 |
Source: Public Records
Tax History Compared to Growth
Tax History
| Year | Tax Paid | Tax Assessment Tax Assessment Total Assessment is a certain percentage of the fair market value that is determined by local assessors to be the total taxable value of land and additions on the property. | Land | Improvement |
|---|---|---|---|---|
| 2025 | $3,386 | $782,100 | $335,400 | $446,700 |
| 2024 | $3,287 | $748,800 | $322,600 | $426,200 |
| 2023 | $3,179 | $680,700 | $293,200 | $387,500 |
| 2022 | $3,102 | $554,000 | $264,100 | $289,900 |
| 2021 | $3,269 | $542,100 | $258,900 | $283,200 |
| 2020 | $3,168 | $519,300 | $239,000 | $280,300 |
| 2019 | $3,223 | $522,400 | $234,300 | $288,100 |
| 2018 | $3,101 | $489,100 | $241,700 | $247,400 |
| 2017 | $2,947 | $479,200 | $223,100 | $256,100 |
| 2016 | $2,149 | $329,100 | $232,400 | $96,700 |
| 2015 | $2,192 | $342,500 | $232,400 | $110,100 |
| 2014 | $2,463 | $387,800 | $204,500 | $183,300 |
Source: Public Records
Map
Nearby Homes
- 159 Center St Unit 22
- 12 Cross St
- 73 Division St
- 221 Upper County Rd Unit 2A
- 221 Upper County Rd Unit 2A
- 26 Manning Rd
- 47 Telegraph Rd Unit 1
- 12 Candlewood Ln Unit 2-9
- 148 Belmont Rd
- 141 Division St
- 9 Country Ln
- 141 Division St
- 166 Upper County Rd Unit 1-4
- 40 Willow St
- 45 Route 28
- 79 Massachusetts 28
- 3 Fairbanks Dr
- 6 Bayberry Ln
- 11 Ocean Park W
- 82 Pleasant St
- 19 Rogers Way
- 18 South St
- 18 South St Unit 2-8
- 18 South St Unit 2-7
- 18 South St Unit 2-6
- 18 South St Unit 2-5
- 18 South St Unit 2-4
- 18 South St Unit 2-3
- 18 South St Unit 2-2
- 18 South St Unit 2-1
- 18 South St Unit 1-8
- 18 South St Unit 1-7
- 18 South St Unit 1-6
- 18 South St Unit 1-5
- 18 South St Unit 1-4
- 18 South St Unit 1-3
- 18 South St Unit 1-1
- 188 Depot St
- 12 Rogers Way