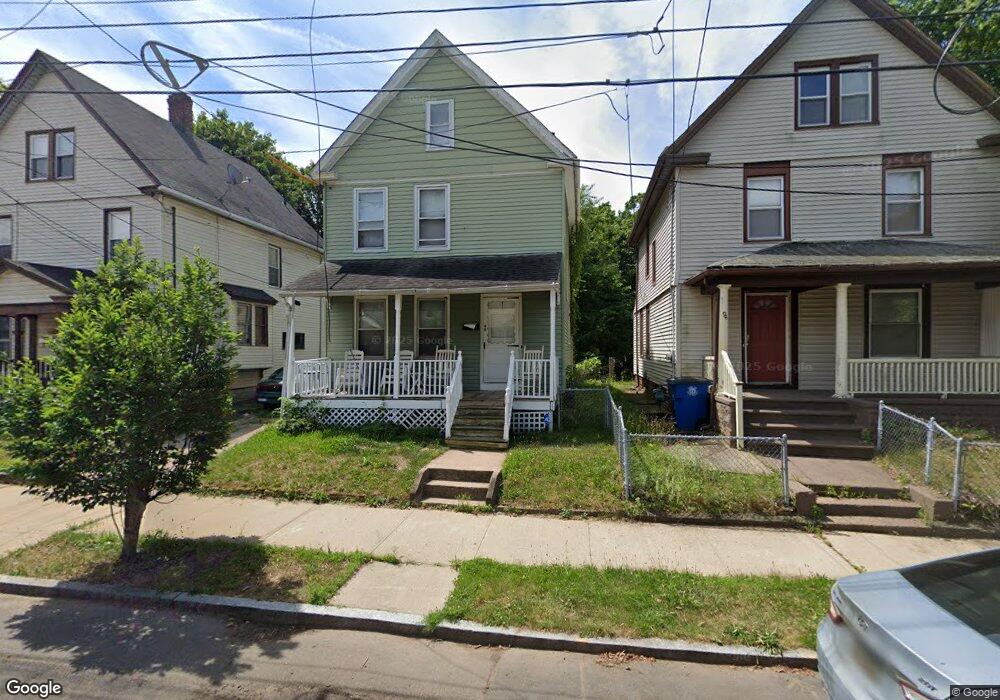
90 Pond St New Haven, CT 06511
Newhallville NeighborhoodEstimated Value: $215,000 - $313,000
3
Beds
1
Bath
1,127
Sq Ft
$234/Sq Ft
Est. Value
About This Home
This home is located at 90 Pond St, New Haven, CT 06511 and is currently estimated at $263,351, approximately $233 per square foot. 90 Pond St is a home located in New Haven County with nearby schools including King/Robinson Magnet School and Highville Charter School.
Ownership History
Date
Name
Owned For
Owner Type
Purchase Details
Closed on
Nov 5, 2025
Sold by
Gallman Margie and Carmack Denise D
Bought by
90 Pond Llc
Current Estimated Value
Purchase Details
Closed on
Nov 16, 2021
Sold by
Gallman Margie
Bought by
Gallman Margie and Carmack Denise D
Purchase Details
Closed on
May 30, 2019
Sold by
Barnes Mabel A
Bought by
Gallman Margie
Home Financials for this Owner
Home Financials are based on the most recent Mortgage that was taken out on this home.
Original Mortgage
$85,100
Interest Rate
4.1%
Mortgage Type
New Conventional
Purchase Details
Closed on
Jan 23, 1984
Bought by
Barnes Mabel A
Create a Home Valuation Report for This Property
The Home Valuation Report is an in-depth analysis detailing your home's value as well as a comparison with similar homes in the area
Home Values in the Area
Average Home Value in this Area
Purchase History
| Date | Buyer | Sale Price | Title Company |
|---|---|---|---|
| 90 Pond Llc | $140,000 | -- | |
| Gallman Margie | -- | None Available | |
| Gallman Margie | $105,000 | -- | |
| Barnes Mabel A | -- | -- |
Source: Public Records
Mortgage History
| Date | Status | Borrower | Loan Amount |
|---|---|---|---|
| Previous Owner | Gallman Margie | $85,100 | |
| Previous Owner | Barnes Mabel A | $60,000 | |
| Previous Owner | Barnes Mabel A | $28,000 |
Source: Public Records
Tax History Compared to Growth
Tax History
| Year | Tax Paid | Tax Assessment Tax Assessment Total Assessment is a certain percentage of the fair market value that is determined by local assessors to be the total taxable value of land and additions on the property. | Land | Improvement |
|---|---|---|---|---|
| 2025 | $4,355 | $110,530 | $32,620 | $77,910 |
| 2024 | $4,255 | $110,530 | $32,620 | $77,910 |
| 2023 | $4,112 | $110,530 | $32,620 | $77,910 |
| 2022 | $4,394 | $110,530 | $32,620 | $77,910 |
| 2021 | $3,351 | $76,370 | $26,110 | $50,260 |
| 2020 | $3,351 | $76,370 | $26,110 | $50,260 |
| 2019 | $3,282 | $76,370 | $26,110 | $50,260 |
| 2018 | $3,282 | $76,370 | $26,110 | $50,260 |
| 2017 | $2,954 | $76,370 | $26,110 | $50,260 |
| 2016 | $2,522 | $60,690 | $11,620 | $49,070 |
| 2015 | $2,522 | $60,690 | $11,620 | $49,070 |
| 2014 | $2,522 | $60,690 | $11,620 | $49,070 |
Source: Public Records
Map
Nearby Homes
- 118 Cherry Ann St
- 84 Willis St
- 48 Willis St
- 773 Dixwell Ave
- 241 W Ivy St
- 79 Bowen St
- 641 Fitch St
- 248 W Ivy St
- 52 Pine St
- 97 Goodyear St
- 407 Shelton Ave
- 39 Edwards St
- 174 Butler St
- 40 Harding Place
- 81 Butler St
- 516 Dixwell Ave
- 245 Goodrich St
- 1830 Ella T Grasso Blvd
- 255 Starr St
- 255 Pine Rock Ave Unit 8