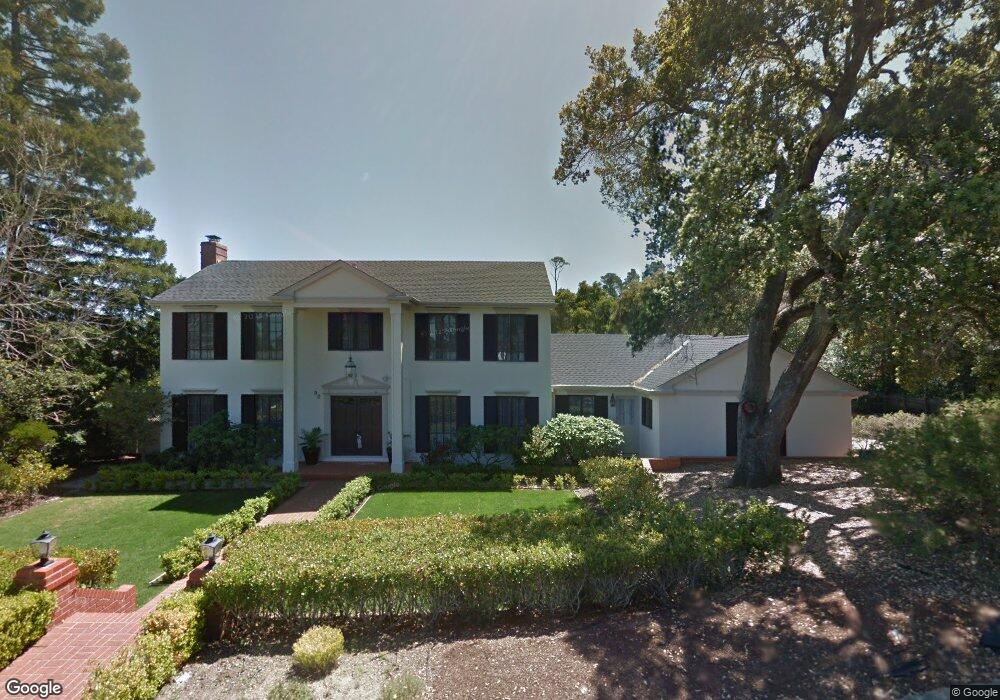
90 Rowan Tree Ln Hillsborough, CA 94010
Skyfarm NeighborhoodEstimated Value: $4,160,000 - $5,151,000
4
Beds
3
Baths
3,060
Sq Ft
$1,544/Sq Ft
Est. Value
About This Home
This home is located at 90 Rowan Tree Ln, Hillsborough, CA 94010 and is currently estimated at $4,725,436, approximately $1,544 per square foot. 90 Rowan Tree Ln is a home located in San Mateo County with nearby schools including West Hillsborough, Crocker Middle School, and Burlingame High School.
Ownership History
Date
Name
Owned For
Owner Type
Purchase Details
Closed on
Dec 9, 2022
Sold by
Ayoub Majda R
Bought by
Ayoub Investments Ii Llc
Current Estimated Value
Purchase Details
Closed on
Jan 4, 2021
Sold by
Ayoub Majda and Ayoub Majda R
Bought by
Ayoub Basil J and Ayoub Mona I
Purchase Details
Closed on
Dec 6, 2012
Sold by
Ayoub Kamel J and Ayoub Majda R
Bought by
Ayoub Investments Llc
Purchase Details
Closed on
Mar 16, 2010
Sold by
Hsia Wei Liang and Hsia Pingsu
Bought by
Ayoub Kamel J and Ayoub Majda R
Home Financials for this Owner
Home Financials are based on the most recent Mortgage that was taken out on this home.
Original Mortgage
$1,282,800
Interest Rate
5%
Mortgage Type
New Conventional
Purchase Details
Closed on
Aug 8, 1995
Sold by
Hsia Wei Liang and Hsia Ping Su Hsu
Bought by
Hsia Wei Liang and Hsia Pingsu Hsu
Purchase Details
Closed on
Oct 18, 1994
Sold by
Adams Bruce K and Adams Elvera Steiner
Bought by
Hsia Wei Liang and Hsia Ping Su Hsu
Create a Home Valuation Report for This Property
The Home Valuation Report is an in-depth analysis detailing your home's value as well as a comparison with similar homes in the area
Home Values in the Area
Average Home Value in this Area
Purchase History
| Date | Buyer | Sale Price | Title Company |
|---|---|---|---|
| Ayoub Investments Ii Llc | -- | -- | |
| Ayoub Basil J | -- | None Available | |
| Ayoub Majda | -- | None Available | |
| Ayoub Investments Llc | -- | None Available | |
| Ayoub Kamel J | $2,138,000 | North American Title Company | |
| Hsia Wei Liang | -- | -- | |
| Hsia Wei Liang | -- | North American Title Company |
Source: Public Records
Mortgage History
| Date | Status | Borrower | Loan Amount |
|---|---|---|---|
| Previous Owner | Ayoub Kamel J | $1,282,800 |
Source: Public Records
Tax History Compared to Growth
Tax History
| Year | Tax Paid | Tax Assessment Tax Assessment Total Assessment is a certain percentage of the fair market value that is determined by local assessors to be the total taxable value of land and additions on the property. | Land | Improvement |
|---|---|---|---|---|
| 2025 | $37,391 | $2,874,476 | $1,379,884 | $1,494,592 |
| 2023 | $37,391 | $2,762,858 | $1,326,302 | $1,436,556 |
| 2022 | $35,198 | $2,708,687 | $1,300,297 | $1,408,390 |
| 2021 | $34,509 | $2,655,576 | $1,274,801 | $1,380,775 |
| 2020 | $33,884 | $2,628,348 | $1,261,730 | $1,366,618 |
| 2019 | $33,068 | $2,576,814 | $1,236,991 | $1,339,823 |
| 2018 | $32,071 | $2,526,290 | $1,212,737 | $1,313,553 |
| 2017 | $30,943 | $2,427,916 | $1,188,958 | $1,238,958 |
| 2016 | $29,557 | $2,331,292 | $1,165,646 | $1,165,646 |
| 2015 | $29,063 | $2,296,274 | $1,148,137 | $1,148,137 |
| 2014 | $28,295 | $2,251,294 | $1,125,647 | $1,125,647 |
Source: Public Records
Map
Nearby Homes
- 2530 Skyfarm Dr
- 855 Darrell Rd
- 20 Pine Ct
- 2496 Butternut Dr
- 75 Eugenia Way
- 588 Craig Rd
- 1035 Macadamia Dr
- 3085 Ralston Ave
- 530 Darrell Rd
- 3080A Ralston Ave
- 1162 Barroilhet Dr
- 414 Pinehill Rd
- 55 Del Monte Dr
- 125 Stonepine Rd
- 2155 Geri Ln
- 2684 Summit Dr
- 2704 Summit Dr
- 11 La Strada Ct
- 515 N San Raymundo Rd
- 55 Fagan Dr
- 80 Rowan Tree Ln
- 100 Rowan Tree Ln
- 95 Rowan Tree Ln Unit 1
- 95 Rowan Tree Ln Unit 2
- 95 Rowan Tree Ln
- 85 Rowan Tree Ln
- 70 Rowan Tree Ln
- 75 Rowan Tree Ln
- 105 Rowan Tree Ln
- 2540 Skyfarm Dr
- 110 Rowan Tree Ln
- 2550 Skyfarm Dr
- 65 Rowan Tree Ln
- 60 Rowan Tree Ln
- 2560 Skyfarm Dr
- 2555 Skyfarm Dr
- 2570 Skyfarm Dr
- 55 Rowan Tree Ln
- 2565 Skyfarm Dr
- 2545 Skyfarm Dr