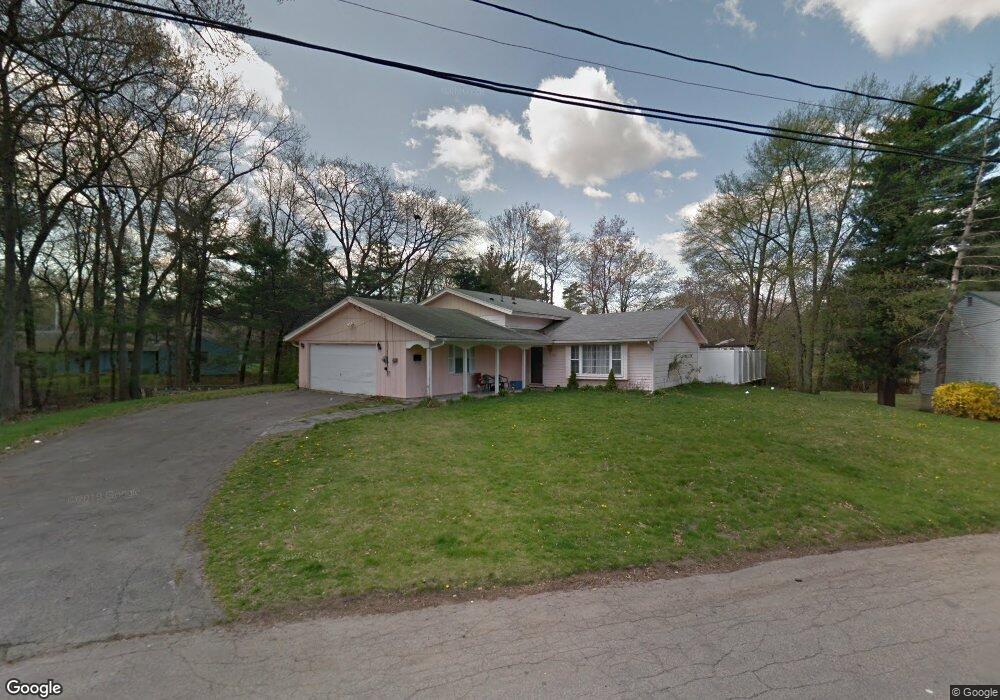
90 Sinclair Rd Brockton, MA 02302
Estimated Value: $553,000 - $596,000
3
Beds
3
Baths
1,872
Sq Ft
$306/Sq Ft
Est. Value
About This Home
This home is located at 90 Sinclair Rd, Brockton, MA 02302 and is currently estimated at $573,093, approximately $306 per square foot. 90 Sinclair Rd is a home located in Plymouth County with nearby schools including Gilmore Elementary School, Davis K-8 School, and John F. Kennedy Elementary School.
Ownership History
Date
Name
Owned For
Owner Type
Purchase Details
Closed on
Nov 15, 2004
Sold by
Netland Edward A and Netland Gail E
Bought by
Hansbury Joy S
Current Estimated Value
Home Financials for this Owner
Home Financials are based on the most recent Mortgage that was taken out on this home.
Original Mortgage
$262,800
Interest Rate
5.75%
Mortgage Type
Purchase Money Mortgage
Create a Home Valuation Report for This Property
The Home Valuation Report is an in-depth analysis detailing your home's value as well as a comparison with similar homes in the area
Purchase History
| Date | Buyer | Sale Price | Title Company |
|---|---|---|---|
| Hansbury Joy S | $292,000 | -- |
Source: Public Records
Mortgage History
| Date | Status | Borrower | Loan Amount |
|---|---|---|---|
| Open | Hansbury Joy S | $262,000 | |
| Closed | Hansbury Joy S | $262,800 | |
| Previous Owner | Hansbury Joy S | $40,000 |
Source: Public Records
Tax History
| Year | Tax Paid | Tax Assessment Tax Assessment Total Assessment is a certain percentage of the fair market value that is determined by local assessors to be the total taxable value of land and additions on the property. | Land | Improvement |
|---|---|---|---|---|
| 2025 | $5,820 | $480,600 | $163,000 | $317,600 |
| 2024 | $5,511 | $458,500 | $163,000 | $295,500 |
| 2023 | $5,101 | $393,000 | $113,400 | $279,600 |
| 2022 | $4,715 | $337,500 | $103,100 | $234,400 |
| 2021 | $4,717 | $325,300 | $96,600 | $228,700 |
| 2020 | $4,865 | $321,100 | $84,400 | $236,700 |
| 2019 | $5,301 | $341,100 | $81,000 | $260,100 |
| 2018 | $4,532 | $282,200 | $81,000 | $201,200 |
| 2017 | $4,210 | $261,500 | $81,000 | $180,500 |
| 2016 | $4,196 | $241,700 | $77,200 | $164,500 |
| 2015 | $4,423 | $243,700 | $77,200 | $166,500 |
| 2014 | $4,418 | $243,700 | $77,200 | $166,500 |
Source: Public Records
Map
Nearby Homes
- 23 Dondi Rd
- 118 Deanna Rd
- 578 Plain St
- 15 Wachusetts Rd
- 12 Paulin Ave
- 1 Thomas Cir
- 549 Summer St
- 111 Riverview St
- 9 Longworth Ave Unit 135
- 9 Longworth Ave Unit 113
- 15 Longworth Ave Unit 226
- 463 Pleasant St
- 25 Longworth Ave Unit 4
- 35 Longworth Ave Unit 25
- 31 Friendship Dr
- 41 Riverview St
- 16 Liberty St
- 16 Jason Way
- 383 Summer St
- 100 Concord St
Your Personal Tour Guide
Ask me questions while you tour the home.