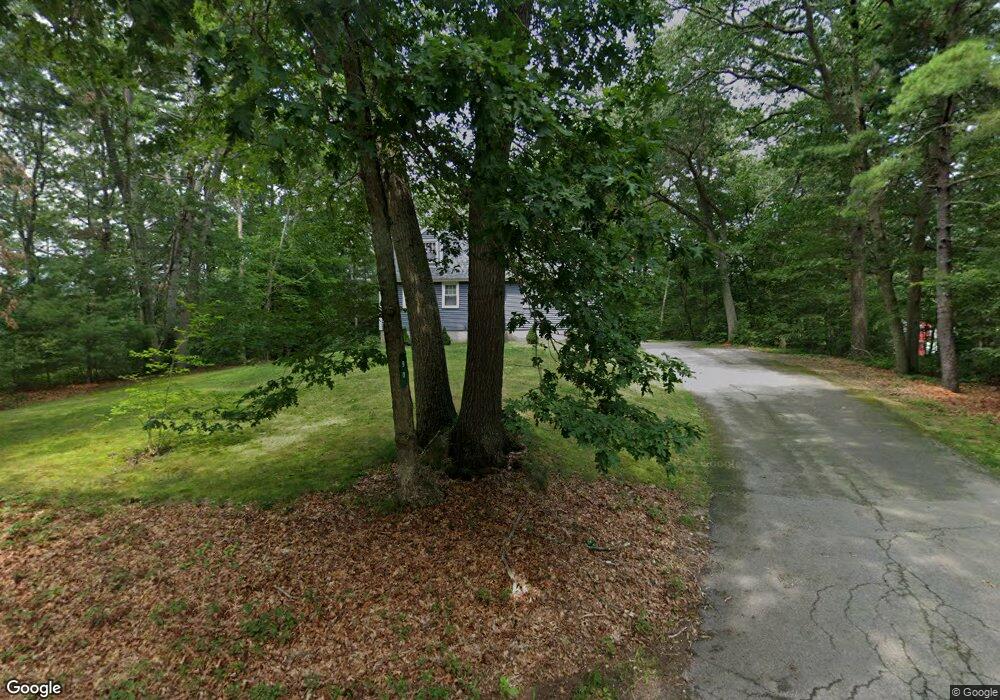
90 Spring St Wrentham, MA 02093
West Wrentham NeighborhoodEstimated Value: $581,000 - $723,000
4
Beds
2
Baths
1,729
Sq Ft
$379/Sq Ft
Est. Value
About This Home
This home is located at 90 Spring St, Wrentham, MA 02093 and is currently estimated at $656,138, approximately $379 per square foot. 90 Spring St is a home located in Norfolk County with nearby schools including Delaney Elementary School, Charles E Roderick, and Mercymount Country Day School.
Ownership History
Date
Name
Owned For
Owner Type
Purchase Details
Closed on
Nov 28, 2011
Sold by
90 Spring Street Rt and Fey Nicholas G
Bought by
Paulson David J and Paulson Lisa M
Current Estimated Value
Home Financials for this Owner
Home Financials are based on the most recent Mortgage that was taken out on this home.
Original Mortgage
$261,250
Outstanding Balance
$179,654
Interest Rate
4.12%
Mortgage Type
Purchase Money Mortgage
Estimated Equity
$476,484
Purchase Details
Closed on
Oct 28, 2004
Sold by
Snow Mark and Sweeney William H
Bought by
Fey Jennifer D and Fey Nicholas G
Home Financials for this Owner
Home Financials are based on the most recent Mortgage that was taken out on this home.
Original Mortgage
$333,700
Interest Rate
5.74%
Mortgage Type
Purchase Money Mortgage
Purchase Details
Closed on
Oct 11, 2002
Sold by
Est Lynch Robert E and Lynch Edward
Bought by
Sweeney William H
Home Financials for this Owner
Home Financials are based on the most recent Mortgage that was taken out on this home.
Original Mortgage
$243,750
Interest Rate
6.24%
Mortgage Type
Purchase Money Mortgage
Create a Home Valuation Report for This Property
The Home Valuation Report is an in-depth analysis detailing your home's value as well as a comparison with similar homes in the area
Home Values in the Area
Average Home Value in this Area
Purchase History
| Date | Buyer | Sale Price | Title Company |
|---|---|---|---|
| Paulson David J | $275,000 | -- | |
| Fey Jennifer D | $384,000 | -- | |
| Sweeney William H | $325,000 | -- |
Source: Public Records
Mortgage History
| Date | Status | Borrower | Loan Amount |
|---|---|---|---|
| Open | Paulson David J | $261,250 | |
| Previous Owner | Fey Jennifer D | $333,700 | |
| Previous Owner | Sweeney William H | $243,750 |
Source: Public Records
Tax History
| Year | Tax Paid | Tax Assessment Tax Assessment Total Assessment is a certain percentage of the fair market value that is determined by local assessors to be the total taxable value of land and additions on the property. | Land | Improvement |
|---|---|---|---|---|
| 2025 | $6,373 | $549,900 | $288,000 | $261,900 |
| 2024 | $6,142 | $511,800 | $288,000 | $223,800 |
| 2023 | $5,924 | $469,400 | $261,900 | $207,500 |
| 2022 | $5,832 | $426,600 | $255,100 | $171,500 |
| 2021 | $5,646 | $401,300 | $238,400 | $162,900 |
| 2020 | $5,080 | $356,500 | $182,000 | $174,500 |
| 2019 | $4,907 | $347,500 | $182,000 | $165,500 |
| 2018 | $4,963 | $348,500 | $181,800 | $166,700 |
| 2017 | $4,670 | $327,700 | $178,300 | $149,400 |
| 2016 | $4,591 | $321,500 | $173,200 | $148,300 |
| 2015 | $4,448 | $296,900 | $166,500 | $130,400 |
| 2014 | $4,376 | $285,800 | $160,100 | $125,700 |
Source: Public Records
Map
Nearby Homes
- 10 Follett Dr
- 9 Reagan Ave
- 60 Grant Ave
- 1620 West St
- 1565 West St
- 900 Washington St Lot 2
- 25 Nature View Dr
- 20 Nature View Dr
- 925 Washington St
- 365 W Wrentham Rd
- 180 Pine Swamp Rd
- 56 Pine Swamp Rd
- 9 Pebble Cir Unit 9
- 9 Brookfield Ln
- 65 Palmetto Dr Unit 65
- 21 Palmetto Dr Unit 21
- 24 Palmetto Dr Unit 24
- 18 Bubbling Brook Rd
- 47 Austin Dr
- 4 Carnation St
Your Personal Tour Guide
Ask me questions while you tour the home.