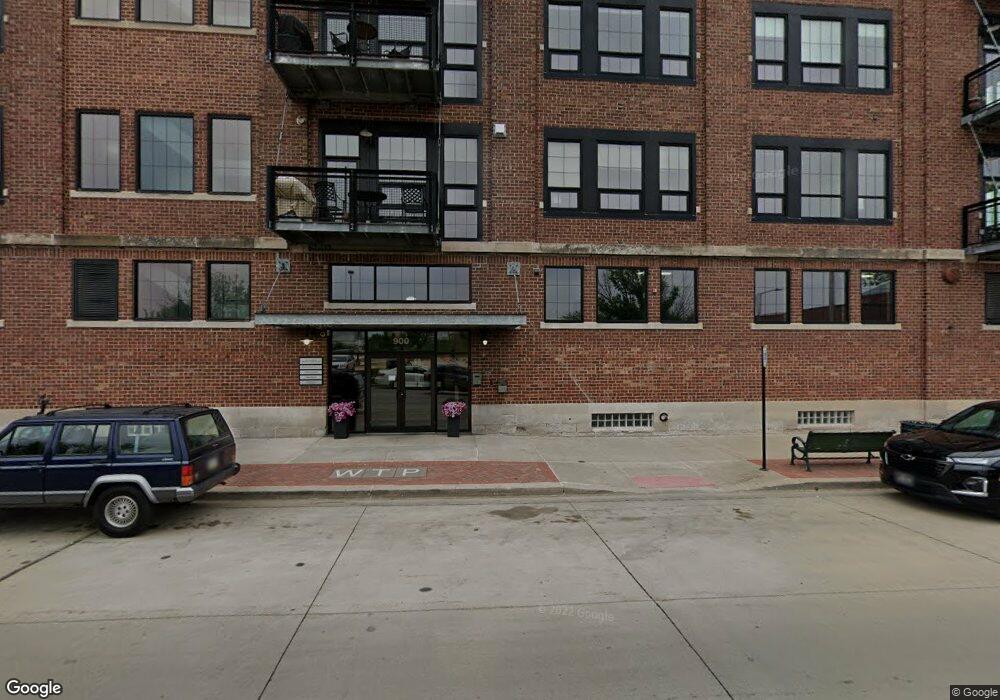
900 2nd St SE Cedar Rapids, IA 52401
Oak Hill Jackson NeighborhoodEstimated Value: $435,000 - $512,000
1
Bed
2
Baths
1,999
Sq Ft
$235/Sq Ft
Est. Value
About This Home
This home is located at 900 2nd St SE, Cedar Rapids, IA 52401 and is currently estimated at $469,025, approximately $234 per square foot. 900 2nd St SE is a home located in Linn County with nearby schools including Grant Wood Elementary School, McKinley STEAM Academy, and George Washington High School.
Ownership History
Date
Name
Owned For
Owner Type
Purchase Details
Closed on
Dec 4, 2024
Sold by
Geraldine K Mcgrath Revocable Trust and Mcgrath Geraldine K
Bought by
Venteicher Matthew J and Venteicher Donna S
Current Estimated Value
Home Financials for this Owner
Home Financials are based on the most recent Mortgage that was taken out on this home.
Original Mortgage
$376,000
Outstanding Balance
$376,000
Interest Rate
6.54%
Mortgage Type
New Conventional
Estimated Equity
$106,945
Purchase Details
Closed on
Nov 16, 2017
Sold by
Mcgrath Bruce D and Mcgrath Geraldine Kathryn
Bought by
Mcgrath Bruce D and Geraldine K Mcgrath Revocable Trust
Purchase Details
Closed on
Mar 14, 2007
Sold by
Water Tower Place Llc
Bought by
Barrigar Donald D and Barrigar Diann
Home Financials for this Owner
Home Financials are based on the most recent Mortgage that was taken out on this home.
Original Mortgage
$150,000
Interest Rate
6.25%
Mortgage Type
Credit Line Revolving
Create a Home Valuation Report for This Property
The Home Valuation Report is an in-depth analysis detailing your home's value as well as a comparison with similar homes in the area
Home Values in the Area
Average Home Value in this Area
Purchase History
| Date | Buyer | Sale Price | Title Company |
|---|---|---|---|
| Venteicher Matthew J | $470,000 | River Ridge Escrow | |
| Mcgrath Bruce D | -- | None Available | |
| Barrigar Donald D | $353,000 | None Available |
Source: Public Records
Mortgage History
| Date | Status | Borrower | Loan Amount |
|---|---|---|---|
| Open | Venteicher Matthew J | $376,000 | |
| Previous Owner | Barrigar Donald D | $179,000 | |
| Previous Owner | Barrigar Donald D | $150,000 | |
| Previous Owner | Barrigar Donald D | $188,000 |
Source: Public Records
Tax History Compared to Growth
Tax History
| Year | Tax Paid | Tax Assessment Tax Assessment Total Assessment is a certain percentage of the fair market value that is determined by local assessors to be the total taxable value of land and additions on the property. | Land | Improvement |
|---|---|---|---|---|
| 2024 | $8,784 | $494,400 | $39,500 | $454,900 |
| 2023 | $8,784 | $444,900 | $35,500 | $409,400 |
| 2022 | $8,628 | $416,500 | $38,000 | $378,500 |
| 2021 | $8,998 | $416,500 | $38,000 | $378,500 |
| 2020 | $8,998 | $407,800 | $38,000 | $369,800 |
| 2019 | $8,436 | $391,400 | $38,000 | $353,400 |
| 2018 | $530 | $391,400 | $38,000 | $353,400 |
| 2017 | $1,384 | $26,100 | $15,000 | $11,100 |
| 2016 | $1,384 | $65,100 | $15,000 | $50,100 |
| 2015 | $2,366 | $111,237 | $15,000 | $96,237 |
| 2014 | $2,366 | $73,991 | $15,000 | $58,991 |
| 2013 | -- | $73,991 | $15,000 | $58,991 |
Source: Public Records
Map
Nearby Homes
- 905 3rd St SE Unit 308
- 905 3rd St SE Unit 205
- 905 3rd St SE Unit 305
- Lot 42 Kestrel Heights
- 329 12th Ave SE
- 400 1st St SE Unit 301
- 400 1st St SE Unit 410
- 1021 9th St SE
- 200 3rd Ave SE Unit 301
- 116 6th Ave SW
- 517 2nd St SW
- 525 2nd St SW
- 728 4th Ave SE
- 912 10th St SE
- 317 8th St SE
- 513 2nd St SW
- 100 4th Ave SW Unit 204
- 1025 11th Ave SE
- 222 5th Ave SW
- 512 Mckinley St SE
- 900 2nd St SE
- 900 2nd St SE
- 900 2nd St SE Unit 608
- 900 2nd St SE
- 900 2nd St SE
- 900 2nd St SE
- 900 2nd St SE
- 900 2nd St SE
- 900 2nd St SE
- 900 2nd St SE Unit 507
- 900 2nd St SE Unit 506
- 900 2nd St SE Unit 503
- 900 2nd St SE Unit 501
- 900 2nd St SE Unit 410
- 900 2nd St SE
- 900 2nd St SE
- 900 2nd St SE Unit 407
- 900 2nd St SE Unit 406
- 900 2nd St SE Unit 405
- 900 2nd St SE