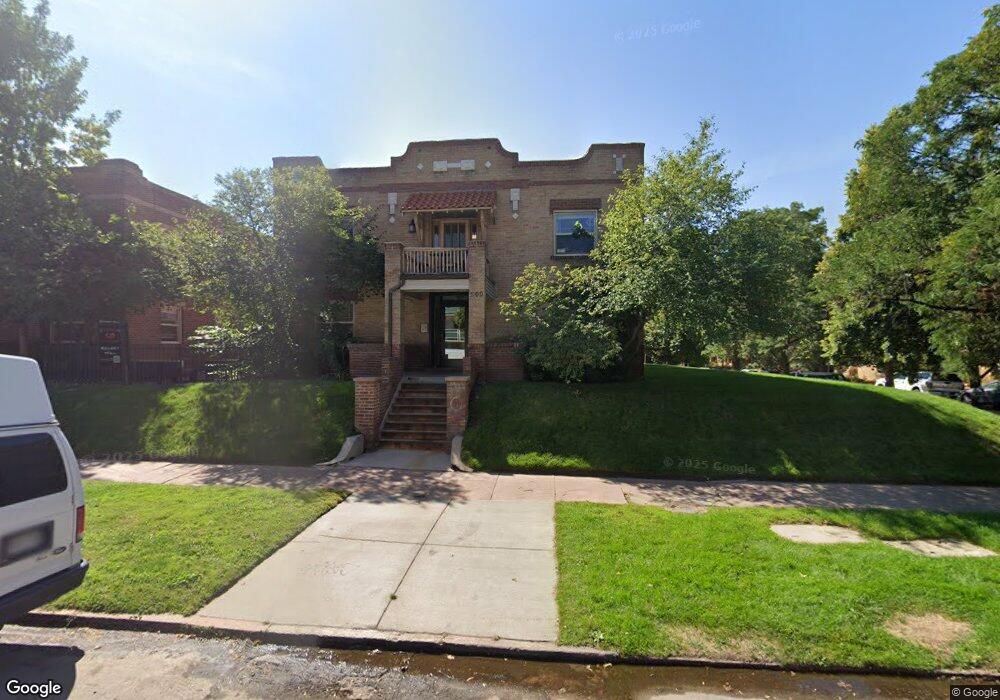
900 E 12th Ave Denver, CO 80218
Capitol Hill Neighborhood
1
Bed
1
Bath
475
Sq Ft
--
Built
About This Home
All of the charm, with modern updates! Kelsey Hill offers renovated 1-bedroom apartments in historic Capitol Hill. Enjoy hardwood floors, gorgeous new kitchens with gas range, dishwasher and dining nook, and brand-new bathrooms. There’s on-site laundry, a courtyard with gas grill, and a shared deck. 2 pets are allowed, with a 60-lb max each.
Kelsey Hill Apartments are located in Denver’s Capitol Hill neighborhood. Walk to local shopping, eating and drinking establishments, including Whole Foods, Potager, Thump Coffee and Cheesman Park.
Urban Phenix Broker License Number: CO : 100057336–EC
Urban Phenix Corporate Number (not used for leasing):
Create a Home Valuation Report for This Property
The Home Valuation Report is an in-depth analysis detailing your home's value as well as a comparison with similar homes in the area
Home Values in the Area
Average Home Value in this Area
Property History
| Date | Event | Price | List to Sale | Price per Sq Ft |
|---|---|---|---|---|
| 09/16/2023 09/16/23 | Price Changed | $1,189 | -14.8% | $3 / Sq Ft |
| 09/07/2023 09/07/23 | For Rent | $1,395 | 0.0% | -- |
| 07/13/2023 07/13/23 | For Rent | $1,395 | 0.0% | -- |
| 06/19/2023 06/19/23 | For Rent | $1,395 | 0.0% | -- |
| 05/19/2023 05/19/23 | Price Changed | $1,395 | +16.7% | $3 / Sq Ft |
| 04/28/2023 04/28/23 | Price Changed | $1,195 | -14.3% | $3 / Sq Ft |
| 04/19/2023 04/19/23 | Price Changed | $1,395 | -6.7% | $3 / Sq Ft |
| 03/28/2023 03/28/23 | Price Changed | $1,495 | +11.2% | $4 / Sq Ft |
| 03/27/2023 03/27/23 | Price Changed | $1,345 | +8.0% | $3 / Sq Ft |
| 03/23/2023 03/23/23 | For Rent | $1,245 | -- | -- |
Tax History
| Year | Tax Paid | Tax Assessment Tax Assessment Total Assessment is a certain percentage of the fair market value that is determined by local assessors to be the total taxable value of land and additions on the property. | Land | Improvement |
|---|---|---|---|---|
| 2025 | $25,813 | $388,050 | $56,210 | $56,210 |
| 2024 | $25,813 | $325,910 | $49,730 | $276,180 |
| 2023 | $25,253 | $325,910 | $49,730 | $276,180 |
| 2022 | $24,535 | $308,520 | $54,220 | $254,300 |
| 2021 | $24,206 | $324,400 | $57,010 | $267,390 |
| 2020 | $23,404 | $315,440 | $53,450 | $261,990 |
| 2019 | $22,748 | $315,440 | $53,450 | $261,990 |
| 2018 | $19,681 | $254,390 | $50,230 | $204,160 |
| 2017 | $19,622 | $254,390 | $50,230 | $204,160 |
| 2016 | $18,930 | $232,130 | $51,565 | $180,565 |
| 2015 | $18,136 | $232,130 | $51,565 | $180,565 |
| 2014 | $12,249 | $147,480 | $34,889 | $112,591 |
Source: Public Records
Map
Nearby Homes
- 1175 N Emerson St Unit 212
- 1175 N Emerson St Unit 305
- 1175 N Emerson St Unit 211
- 1175 N Emerson St Unit 202
- 1233 N Ogden St Unit 610
- 1233 N Ogden St Unit 503
- 1233 N Ogden St Unit 105
- 1148 Corona St
- 1120 N Clarkson St Unit 2
- 1255 N Ogden St Unit 205
- 1057 N Emerson St Unit A
- 1107 N Downing St
- 1217 N Downing St Unit 4
- 1050 N Corona St Unit 317
- 1050 N Corona St Unit 215
- 1050 N Corona St Unit 216
- 1140 N Downing St Unit 305
- 1166 N Downing St
- 1080 E 13th Ave Unit 403
- 1045 N Clarkson St Unit 207
- 910 E 12th Ave
- 1152 Emerson St
- 1152 N Emerson St Unit 2
- 1152 N Emerson St
- 1144 Emerson St
- 1175 Emerson St
- 1175 Emerson St Unit 311
- 1175 Emerson St Unit 310
- 1175 Emerson St Unit 309
- 1175 Emerson St
- 1175 Emerson St Unit 307
- 1175 Emerson St
- 1175 Emerson St
- 1175 Emerson St
- 1175 Emerson St Unit 303
- 1175 Emerson St
- 1175 Emerson St Unit 301
- 1175 Emerson St Unit 212
- 1175 Emerson St Unit 211
- 1175 Emerson St Unit 210
Your Personal Tour Guide
Ask me questions while you tour the home.