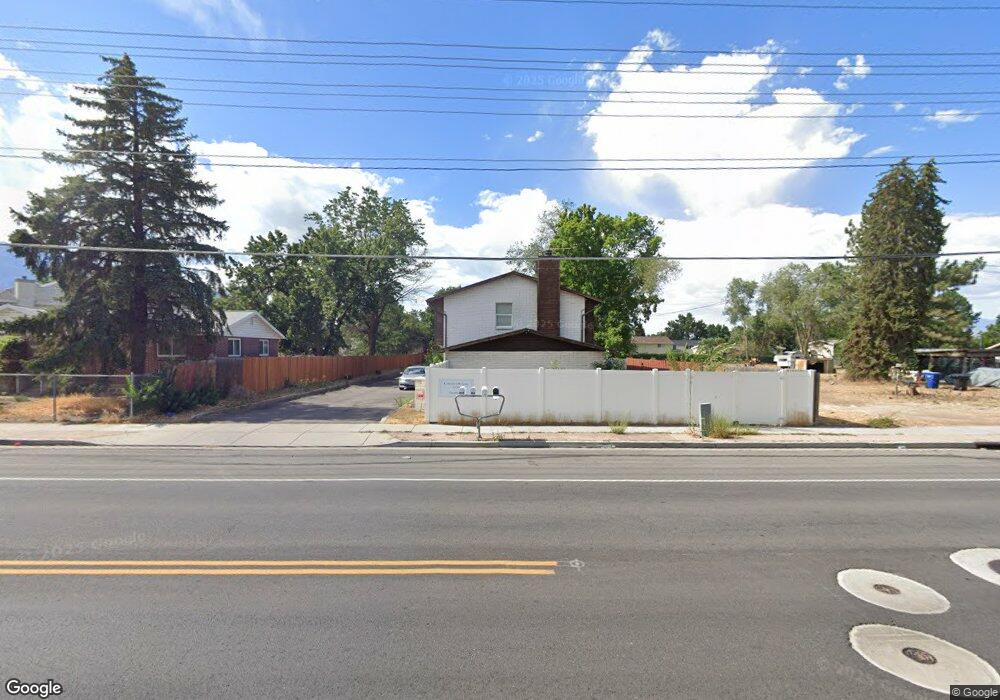
900 E 7800 S Unit 900 Midvale, UT 84047
Estimated Value: $350,000 - $454,000
3
Beds
3
Baths
1,608
Sq Ft
$243/Sq Ft
Est. Value
About This Home
This home is located at 900 E 7800 S Unit 900, Midvale, UT 84047 and is currently estimated at $390,878, approximately $243 per square foot. 900 E 7800 S Unit 900 is a home located in Salt Lake County with nearby schools including East Sandy School, Union Middle School, and Hillcrest High School.
Ownership History
Date
Name
Owned For
Owner Type
Purchase Details
Closed on
Mar 17, 2005
Sold by
Cockburn Allstair A R and Cockburn Deanna G R
Bought by
Clark Holli A
Current Estimated Value
Home Financials for this Owner
Home Financials are based on the most recent Mortgage that was taken out on this home.
Original Mortgage
$17,660
Interest Rate
5.61%
Mortgage Type
Credit Line Revolving
Purchase Details
Closed on
Nov 21, 1995
Sold by
Simons Jennifer
Bought by
Cockburn Alistair A R and Cockburn Deanna G R
Home Financials for this Owner
Home Financials are based on the most recent Mortgage that was taken out on this home.
Original Mortgage
$77,000
Interest Rate
7.51%
Purchase Details
Closed on
Sep 13, 1994
Sold by
Simons Grant
Bought by
Simons Jennifer
Home Financials for this Owner
Home Financials are based on the most recent Mortgage that was taken out on this home.
Original Mortgage
$95,000
Interest Rate
8.37%
Mortgage Type
FHA
Create a Home Valuation Report for This Property
The Home Valuation Report is an in-depth analysis detailing your home's value as well as a comparison with similar homes in the area
Home Values in the Area
Average Home Value in this Area
Purchase History
| Date | Buyer | Sale Price | Title Company |
|---|---|---|---|
| Clark Holli A | -- | 1St Natl Title Ins Agency | |
| Cockburn Alistair A R | -- | -- | |
| Simons Jennifer | -- | -- | |
| Simons Jennifer | -- | -- |
Source: Public Records
Mortgage History
| Date | Status | Borrower | Loan Amount |
|---|---|---|---|
| Closed | Clark Holli A | $17,660 | |
| Open | Clark Holli A | $100,640 | |
| Previous Owner | Cockburn Alistair A R | $77,000 | |
| Previous Owner | Simons Jennifer | $95,000 |
Source: Public Records
Tax History
| Year | Tax Paid | Tax Assessment Tax Assessment Total Assessment is a certain percentage of the fair market value that is determined by local assessors to be the total taxable value of land and additions on the property. | Land | Improvement |
|---|---|---|---|---|
| 2025 | $2,271 | $355,400 | $106,600 | $248,800 |
| 2024 | $2,271 | $347,200 | $104,100 | $243,100 |
| 2023 | $2,271 | $341,400 | $102,400 | $239,000 |
| 2022 | $2,142 | $317,100 | $95,100 | $222,000 |
| 2021 | $2,347 | $303,700 | $91,100 | $212,600 |
| 2020 | $2,267 | $274,000 | $82,200 | $191,800 |
| 2019 | $2,557 | $306,800 | $92,000 | $214,800 |
| 2018 | $2,304 | $272,400 | $81,700 | $190,700 |
| 2017 | $2,112 | $244,300 | $73,300 | $171,000 |
| 2016 | $2,214 | $251,700 | $75,500 | $176,200 |
| 2015 | $2,262 | $239,500 | $71,800 | $167,700 |
| 2014 | $2,300 | $237,100 | $71,100 | $166,000 |
Source: Public Records
Map
Nearby Homes
- 7819 S Spruce Tree Ln
- 7899 S 930 E
- 954 E 7725 S
- 798 E Spruce Tree Ln
- 7692 Chad St
- 7614 S 1000 E
- 760 E 8080 S
- 7755 S 1130 E
- 600 E Briarsprings Cir
- 7640 S Quail Springs Cir
- 973 E Taliesen Cove Unit 203
- 8087 S 615 E
- 8268 S 865 E
- 7579 S 520 E
- 955 E Creekhill Ln Unit 31
- 931 E Creekhill Ln Unit 11
- 8136 S Cottonwood Hills Cir
- 397 E Tractor Dr Unit 103
- 393 E Corral Creek Dr
- 8390 S 745 E
- 902 E 7800 S Unit 902
- 898 E 7800 S
- 896 E 7800 S Unit 896
- 893 E 7865 S
- 7838 White Pine Way
- 7830 White Pine Way
- 7842 White Pine Way
- 7842 S White Pine Way
- 901 E 7865 S
- 910 E 7800 S
- 7846 S White Pine Way
- 7846 White Pine Way
- 7826 S White Pine Way
- 7826 White Pine Way
- 885 E 7865 S
- 886 E 7800 S
- 920 E 7800 S
- 877 E 7865 S
- 926 White Pine Way
- 926 E White Pine Way
Your Personal Tour Guide
Ask me questions while you tour the home.