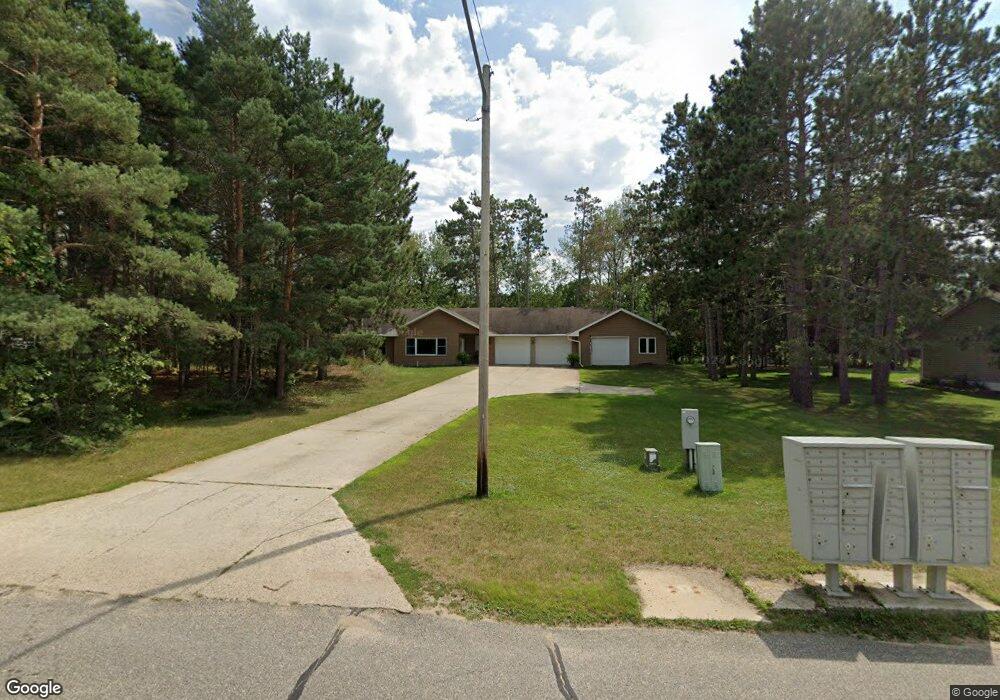
900 North St E Park Rapids, MN 56470
Estimated Value: $300,655 - $393,000
3
Beds
3
Baths
1,624
Sq Ft
$218/Sq Ft
Est. Value
About This Home
This home is located at 900 North St E, Park Rapids, MN 56470 and is currently estimated at $354,664, approximately $218 per square foot. 900 North St E is a home located in Hubbard County with nearby schools including Century Elementary School, Century School, and Park Rapids Area High School.
Ownership History
Date
Name
Owned For
Owner Type
Purchase Details
Closed on
Jun 14, 2019
Sold by
Weldon Jacqueline L and Weldon Bent W
Bought by
Mccoyne Steven and Mccoyne Nancy
Current Estimated Value
Home Financials for this Owner
Home Financials are based on the most recent Mortgage that was taken out on this home.
Original Mortgage
$213,493
Outstanding Balance
$187,332
Interest Rate
4%
Mortgage Type
New Conventional
Estimated Equity
$167,332
Purchase Details
Closed on
Apr 22, 2019
Sold by
James James K K
Bought by
Weldon Jacqueline L and Roell Vincent R
Home Financials for this Owner
Home Financials are based on the most recent Mortgage that was taken out on this home.
Original Mortgage
$213,493
Outstanding Balance
$187,332
Interest Rate
4%
Mortgage Type
New Conventional
Estimated Equity
$167,332
Purchase Details
Closed on
Dec 4, 2006
Sold by
Pederson William L and Pederson Gloria A
Bought by
Roell James K
Create a Home Valuation Report for This Property
The Home Valuation Report is an in-depth analysis detailing your home's value as well as a comparison with similar homes in the area
Home Values in the Area
Average Home Value in this Area
Purchase History
| Date | Buyer | Sale Price | Title Company |
|---|---|---|---|
| Mccoyne Steven | $209,000 | -- | |
| Weldon Jacqueline L | -- | -- | |
| Roell James K | $186,500 | Segue Title & Real Estate Se |
Source: Public Records
Mortgage History
| Date | Status | Borrower | Loan Amount |
|---|---|---|---|
| Open | Mccoyne Steven | $213,493 |
Source: Public Records
Tax History
| Year | Tax Paid | Tax Assessment Tax Assessment Total Assessment is a certain percentage of the fair market value that is determined by local assessors to be the total taxable value of land and additions on the property. | Land | Improvement |
|---|---|---|---|---|
| 2024 | $3,330 | $273,100 | $25,900 | $247,200 |
| 2023 | $3,648 | $288,400 | $23,700 | $264,700 |
| 2022 | $3,046 | $258,100 | $23,700 | $234,400 |
| 2021 | $2,778 | $218,200 | $23,700 | $194,500 |
| 2020 | $2,672 | $183,000 | $21,460 | $161,540 |
| 2019 | $2,346 | $169,300 | $21,174 | $148,126 |
| 2018 | $2,522 | $160,700 | $18,229 | $142,471 |
| 2016 | $2,152 | $143,600 | $17,831 | $125,769 |
| 2015 | $1,924 | $132,800 | $17,536 | $115,264 |
| 2014 | $1,808 | $124,100 | $19,957 | $104,143 |
Source: Public Records
Map
Nearby Homes
- 1003 North St E
- 806 Central Ave N
- 707 Bridge St
- 107 Grove Ave N
- 716 Park Ave N Unit 3
- 300 Central Ave S
- 309 Birch Ct
- ABC Henrietta Ave
- 809 Pine St
- Lot 17 Discovery Cir
- Lot 16 Discovery Cir
- 900 Park Ave N Unit 5
- 503 Lake Ave
- XXX First St E (Hwy 34)
- 16008 Discovery Cir
- 800 Forest Ave
- 18303 County 4
- 31282 U S Highway 71
- 900 Pleasant Ave S
- 603 7th St W
- 601 Forest View Ave
- 901 North St E
- 1009 North St E
- 810 North St E
- 810 North St E
- 602 Forest View Ave
- 603 Forest View Ave
- 802 North St E
- 604 Forest View Ave
- 906 North St E
- 605 Forest View Ave
- 805 805 North-Street-e
- 607 Forest View Ave
- 605 Eastern Ave N
- 606 Forest View Ave
- 805 North St E
- 1001 North St E
- 1001 1001 North-Street-e
- 1002 North St E
- 1002 1002 North-Street-e
Your Personal Tour Guide
Ask me questions while you tour the home.