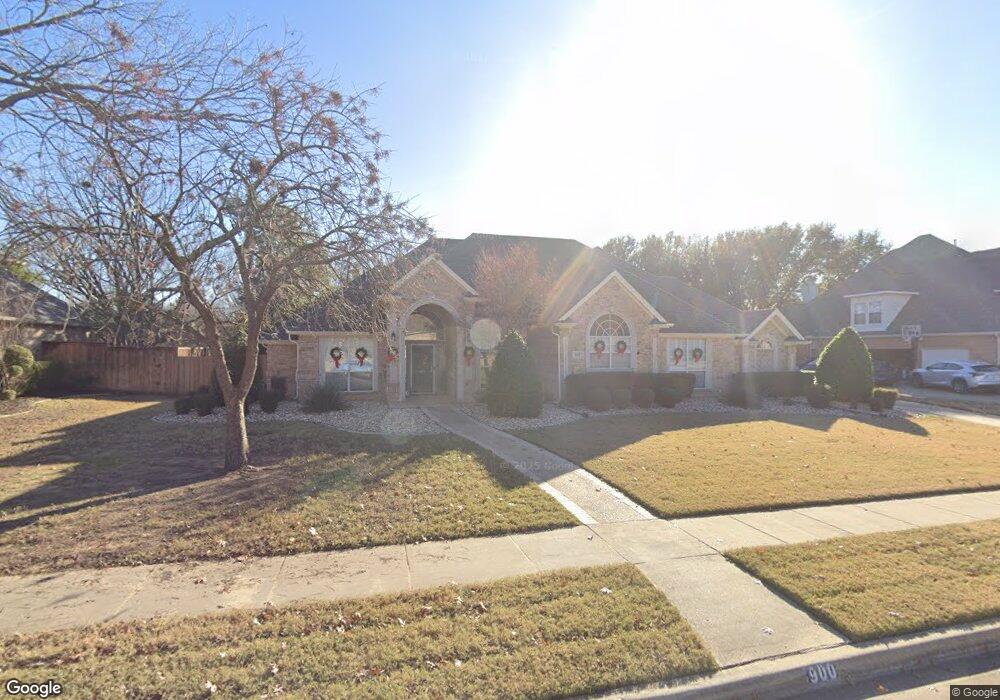
900 Ownby Ln Southlake, TX 76092
Estimated Value: $1,124,906 - $1,217,000
4
Beds
3
Baths
3,247
Sq Ft
$357/Sq Ft
Est. Value
About This Home
This home is located at 900 Ownby Ln, Southlake, TX 76092 and is currently estimated at $1,159,227, approximately $357 per square foot. 900 Ownby Ln is a home located in Tarrant County with nearby schools including Don T. Durham Intermediate School, Walnut Grove Elementary School, and Carroll Middle School.
Ownership History
Date
Name
Owned For
Owner Type
Purchase Details
Closed on
Aug 11, 2008
Sold by
Akers Diane Kay and Akers Thomas Ray
Bought by
Carlson David N and Carlson Kelly C
Current Estimated Value
Purchase Details
Closed on
Jun 17, 1994
Sold by
K M Properties
Bought by
Akers Thomas Ray and Akers Diane Kay
Home Financials for this Owner
Home Financials are based on the most recent Mortgage that was taken out on this home.
Original Mortgage
$160,000
Interest Rate
6.75%
Purchase Details
Closed on
Jan 26, 1994
Sold by
Southview Phase Ii Joint Venture
Bought by
Km Properties Inc
Home Financials for this Owner
Home Financials are based on the most recent Mortgage that was taken out on this home.
Original Mortgage
$176,250
Interest Rate
7.16%
Create a Home Valuation Report for This Property
The Home Valuation Report is an in-depth analysis detailing your home's value as well as a comparison with similar homes in the area
Home Values in the Area
Average Home Value in this Area
Purchase History
| Date | Buyer | Sale Price | Title Company |
|---|---|---|---|
| Carlson David N | -- | Hftc | |
| Akers Thomas Ray | -- | American Title | |
| Km Properties Inc | -- | -- |
Source: Public Records
Mortgage History
| Date | Status | Borrower | Loan Amount |
|---|---|---|---|
| Previous Owner | Akers Thomas Ray | $160,000 | |
| Previous Owner | Km Properties Inc | $176,250 |
Source: Public Records
Tax History Compared to Growth
Tax History
| Year | Tax Paid | Tax Assessment Tax Assessment Total Assessment is a certain percentage of the fair market value that is determined by local assessors to be the total taxable value of land and additions on the property. | Land | Improvement |
|---|---|---|---|---|
| 2025 | $12,788 | $884,000 | $344,700 | $539,300 |
| 2024 | $12,788 | $912,562 | $344,700 | $567,862 |
| 2023 | $14,126 | $995,840 | $344,700 | $651,140 |
| 2022 | $14,205 | $783,546 | $229,800 | $553,746 |
| 2021 | $14,603 | $640,487 | $229,800 | $410,687 |
| 2020 | $14,722 | $640,487 | $206,820 | $433,667 |
| 2019 | $14,650 | $626,197 | $150,000 | $476,197 |
| 2018 | $12,482 | $550,000 | $150,000 | $400,000 |
| 2017 | $13,046 | $619,038 | $150,000 | $469,038 |
| 2016 | $11,860 | $528,086 | $150,000 | $378,086 |
| 2015 | $10,479 | $435,000 | $40,000 | $395,000 |
| 2014 | $10,479 | $435,000 | $40,000 | $395,000 |
Source: Public Records
Map
Nearby Homes
- 806 Ownby Ln
- 807 Cross Ln
- 1032 Rosavine Dr
- 1028 Rosavine Dr
- 1017 Rosavine Dr
- 1004 Rosavine Dr
- 1020 Rosavine Dr
- 1012 Rosavine Dr
- 1024 Rosavine Dr
- 1005 Rosavine Dr
- 1016 Rosavine Dr
- 1008 Rosavine Dr
- 350 Central Ave Unit 202
- 350 Central Ave Unit 503
- 350 Central Ave Unit 201
- 350 Central Ave Unit 307
- 350 Central Ave Unit 310
- 1532 Main St
- 1577 Main St
- 231 Park Ridge Blvd