Estimated Value: $408,416 - $490,000
4
Beds
3
Baths
3,444
Sq Ft
$127/Sq Ft
Est. Value
About This Home
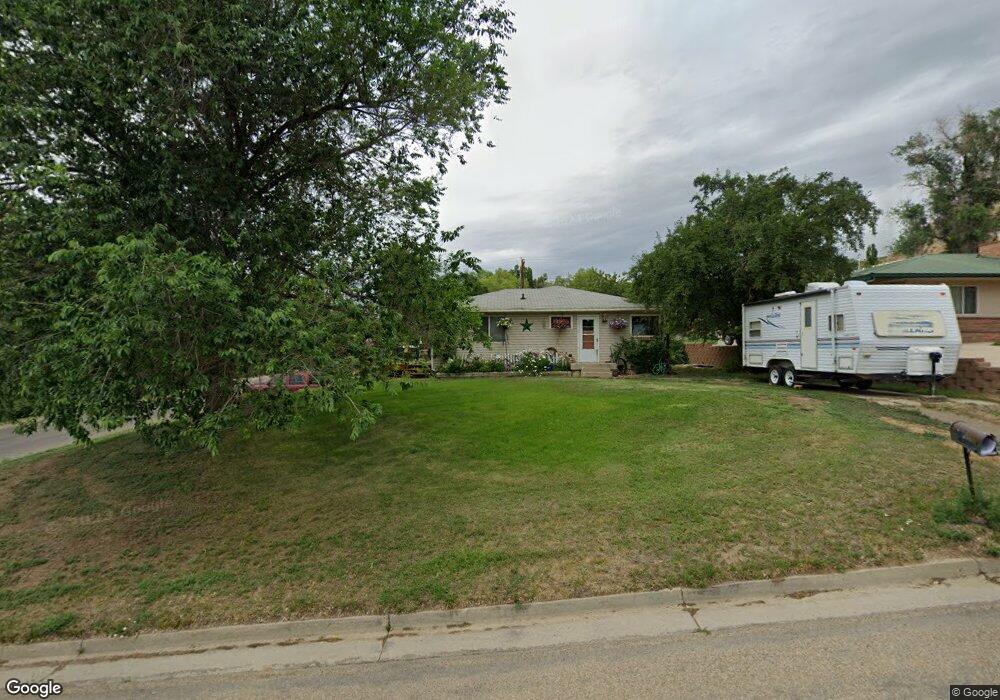
This home is located at 900 Pershing St, Craig, CO 81625 and is currently estimated at $437,104, approximately $126 per square foot. 900 Pershing St is a home located in Moffat County with nearby schools including Sunset Elementary School, Moffat County High School, and Calvary Baptist School.
Ownership History
Date
Name
Owned For
Owner Type
Purchase Details
Closed on
May 19, 2021
Sold by
Gray Jesse Robert
Bought by
Gray Jesse Robert and Gray Teresa Karen
Current Estimated Value
Purchase Details
Closed on
Jun 16, 2008
Sold by
Bohrer Tonya K
Bought by
Gray Jesse Robert
Home Financials for this Owner
Home Financials are based on the most recent Mortgage that was taken out on this home.
Original Mortgage
$178,000
Outstanding Balance
$114,397
Interest Rate
6.08%
Mortgage Type
New Conventional
Estimated Equity
$322,707
Purchase Details
Closed on
Dec 5, 2006
Sold by
Gray Jesse Robert
Bought by
Gray Jesse Robert and Bohrer Tanya K
Create a Home Valuation Report for This Property
The Home Valuation Report is an in-depth analysis detailing your home's value as well as a comparison with similar homes in the area
Home Values in the Area
Average Home Value in this Area
Purchase History
| Date | Buyer | Sale Price | Title Company |
|---|---|---|---|
| Gray Jesse Robert | -- | None Available | |
| Gray Jesse Robert | -- | None Available | |
| Gray Jesse Robert | -- | None Available |
Source: Public Records
Mortgage History
| Date | Status | Borrower | Loan Amount |
|---|---|---|---|
| Open | Gray Jesse Robert | $178,000 |
Source: Public Records
Tax History Compared to Growth
Tax History
| Year | Tax Paid | Tax Assessment Tax Assessment Total Assessment is a certain percentage of the fair market value that is determined by local assessors to be the total taxable value of land and additions on the property. | Land | Improvement |
|---|---|---|---|---|
| 2024 | $1,477 | $17,030 | $0 | $0 |
| 2023 | $1,477 | $17,030 | $1,470 | $15,560 |
| 2022 | $1,406 | $16,680 | $1,860 | $14,820 |
| 2021 | $1,421 | $17,160 | $1,910 | $15,250 |
| 2020 | $1,323 | $16,180 | $1,910 | $14,270 |
| 2019 | $1,310 | $16,180 | $1,910 | $14,270 |
| 2018 | $1,211 | $14,880 | $1,920 | $12,960 |
| 2017 | $1,249 | $14,880 | $1,920 | $12,960 |
| 2016 | $1,304 | $16,070 | $2,130 | $13,940 |
| 2015 | $1,300 | $16,070 | $2,130 | $13,940 |
| 2013 | $1,300 | $15,790 | $2,130 | $13,660 |
Source: Public Records
Map
Nearby Homes
- 885 Stout St
- 909 Ranney St
- 1155 Taylor St
- 951 Alta Vista Dr
- 866 Barclay St
- 908 Ridge Rd
- 720 Barclay St
- 1160 Taylor St
- 900 Breeze St
- 1060 Alta Vista Dr
- 1290 Alta Vista Dr
- 1159 Barclay St
- 353 Breeze St
- Tbd Sunset Cir
- TBD Finley Ln
- 772 Yampa Ave
- 640 School St
- 635 School St
- 1261 Taylor St
- 1295 Barclay St