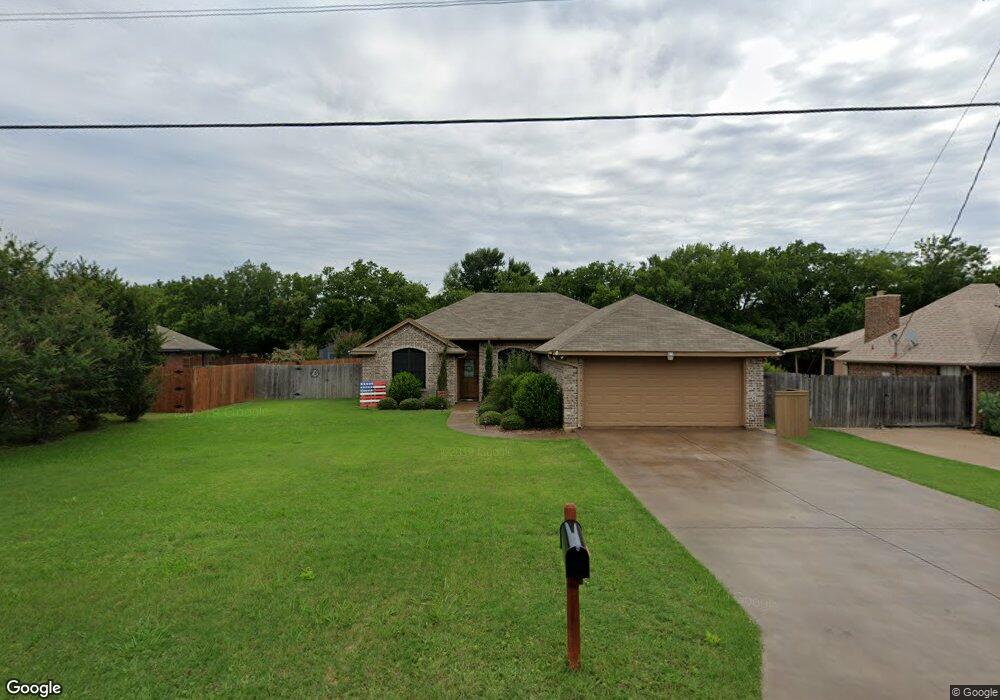
900 Shady Grove Dr Granbury, TX 76049
Estimated Value: $285,377 - $303,000
3
Beds
2
Baths
1,426
Sq Ft
$206/Sq Ft
Est. Value
About This Home
This home is located at 900 Shady Grove Dr, Granbury, TX 76049 and is currently estimated at $293,344, approximately $205 per square foot. 900 Shady Grove Dr is a home located in Hood County with nearby schools including Oak Woods School, Acton Middle School, and Granbury High School.
Ownership History
Date
Name
Owned For
Owner Type
Purchase Details
Closed on
Jul 10, 2020
Sold by
Epperson Emily and Kamp Emily
Bought by
Epperson Emily and Epperson Christopher
Current Estimated Value
Home Financials for this Owner
Home Financials are based on the most recent Mortgage that was taken out on this home.
Original Mortgage
$146,000
Outstanding Balance
$129,174
Interest Rate
3.1%
Mortgage Type
New Conventional
Estimated Equity
$164,170
Purchase Details
Closed on
Mar 14, 2014
Sold by
Lake Granbury Real Estate Enterprises In
Bought by
Kamp Emily
Home Financials for this Owner
Home Financials are based on the most recent Mortgage that was taken out on this home.
Original Mortgage
$140,306
Interest Rate
4.36%
Mortgage Type
New Conventional
Purchase Details
Closed on
Jun 26, 2013
Sold by
Garrett Charlotte
Bought by
Lake Granbury Real Estate Enterprises In
Purchase Details
Closed on
Sep 21, 1987
Sold by
Williams Scott D
Bought by
Kamp Emily
Create a Home Valuation Report for This Property
The Home Valuation Report is an in-depth analysis detailing your home's value as well as a comparison with similar homes in the area
Home Values in the Area
Average Home Value in this Area
Purchase History
| Date | Buyer | Sale Price | Title Company |
|---|---|---|---|
| Epperson Emily | -- | Solidifi Title Agency Ltd | |
| Kamp Emily | -- | Stonewall Title Company | |
| Lake Granbury Real Estate Enterprises In | -- | None Available | |
| Kamp Emily | -- | -- |
Source: Public Records
Mortgage History
| Date | Status | Borrower | Loan Amount |
|---|---|---|---|
| Open | Epperson Emily | $146,000 | |
| Closed | Kamp Emily | $140,306 |
Source: Public Records
Tax History Compared to Growth
Tax History
| Year | Tax Paid | Tax Assessment Tax Assessment Total Assessment is a certain percentage of the fair market value that is determined by local assessors to be the total taxable value of land and additions on the property. | Land | Improvement |
|---|---|---|---|---|
| 2025 | $2,054 | $258,952 | $30,000 | $247,420 |
| 2024 | $1,872 | $235,411 | $30,000 | $276,910 |
| 2023 | $2,604 | $268,060 | $30,000 | $238,060 |
| 2022 | $2,188 | $229,920 | $20,000 | $209,920 |
| 2021 | $2,715 | $176,870 | $10,000 | $166,870 |
| 2020 | $2,819 | $181,540 | $10,000 | $171,540 |
| 2019 | $2,904 | $178,630 | $10,000 | $168,630 |
| 2018 | $2,660 | $163,640 | $10,000 | $153,640 |
| 2017 | $2,438 | $145,800 | $10,000 | $135,800 |
| 2016 | $2,232 | $133,470 | $10,000 | $123,470 |
| 2015 | $2,008 | $127,690 | $10,000 | $117,690 |
| 2014 | $2,008 | $121,230 | $10,000 | $111,230 |
Source: Public Records
Map
Nearby Homes
- 704 Shady Grove Ct
- 502 Shady Grove Dr
- 3224 W Weems Ct
- 2231 Cobblestone Ct
- 210 Davis Rd
- 615 Whisperview Cir
- 157 Business Blvd
- 2009 Rock Dr
- 805 Branding Iron Trail
- 809 Branding Iron Trail
- 811 Branding Iron Trail
- 807 Branding Iron Trail
- 1931 Hidden Valley Rd
- 809 Harness Trail
- Residence 3 Plan at The Residences at Cardinal Woods
- Residence 5 Plan at The Residences at Cardinal Woods
- Residence 4 Plan at The Residences at Cardinal Woods
- Residence 1 Plan at The Residences at Cardinal Woods
- Residence 2 Plan at The Residences at Cardinal Woods
- 2902 Davis Rd
- 812 Shady Grove Dr
- 902 Shady Grove Dr
- 904 Shady Grove Dr
- 810 Shady Grove Dr
- 3100 Shady Grove Cir
- 3101 Shady Grove Cir
- 808 Shady Grove Dr
- 906 Shady Grove Dr
- 3103 Shady Grove Cir
- 915 Davis Rd
- 809 Shady Grove Dr
- 3101 Shady Ln
- 806 Shady Grove Dr
- 908 Shady Grove Dr
- 3104 Shady Grove Cir
- 3103 Shady Ln
- 807 Shady Grove Dr
- 3105 Shady Grove Cir
- 804 Shady Grove Dr
- 3105 Shady Ln