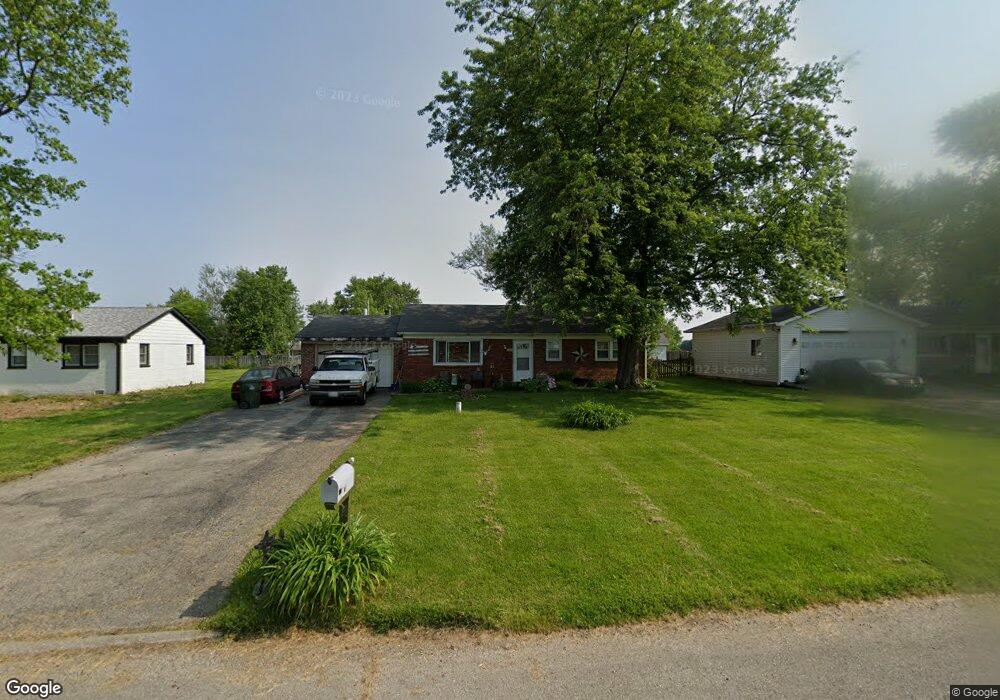
900 W 1080 N Fountaintown, IN 46130
Estimated Value: $165,000 - $192,622
3
Beds
1
Bath
960
Sq Ft
$188/Sq Ft
Est. Value
About This Home
This home is located at 900 W 1080 N, Fountaintown, IN 46130 and is currently estimated at $180,906, approximately $188 per square foot. 900 W 1080 N is a home located in Shelby County with nearby schools including Morristown Elementary School and Morristown Junior/Senior High School.
Ownership History
Date
Name
Owned For
Owner Type
Purchase Details
Closed on
Sep 28, 2006
Sold by
Abrams Andrew W
Bought by
Hankins Cinimen
Current Estimated Value
Home Financials for this Owner
Home Financials are based on the most recent Mortgage that was taken out on this home.
Original Mortgage
$87,500
Outstanding Balance
$52,558
Interest Rate
6.58%
Mortgage Type
New Conventional
Estimated Equity
$128,348
Purchase Details
Closed on
Oct 24, 2005
Sold by
American Residential Equities Llc
Bought by
Abrams Andrew W
Home Financials for this Owner
Home Financials are based on the most recent Mortgage that was taken out on this home.
Original Mortgage
$65,900
Interest Rate
6.13%
Mortgage Type
New Conventional
Create a Home Valuation Report for This Property
The Home Valuation Report is an in-depth analysis detailing your home's value as well as a comparison with similar homes in the area
Home Values in the Area
Average Home Value in this Area
Purchase History
| Date | Buyer | Sale Price | Title Company |
|---|---|---|---|
| Hankins Cinimen | -- | -- | |
| Abrams Andrew W | -- | -- |
Source: Public Records
Mortgage History
| Date | Status | Borrower | Loan Amount |
|---|---|---|---|
| Open | Hankins Cinimen | $87,500 | |
| Previous Owner | Abrams Andrew W | $65,900 |
Source: Public Records
Tax History Compared to Growth
Tax History
| Year | Tax Paid | Tax Assessment Tax Assessment Total Assessment is a certain percentage of the fair market value that is determined by local assessors to be the total taxable value of land and additions on the property. | Land | Improvement |
|---|---|---|---|---|
| 2024 | $817 | $132,700 | $20,600 | $112,100 |
| 2023 | $759 | $128,100 | $20,600 | $107,500 |
| 2022 | $655 | $112,800 | $15,400 | $97,400 |
| 2021 | $581 | $105,200 | $15,400 | $89,800 |
| 2020 | $528 | $101,600 | $15,400 | $86,200 |
| 2019 | $501 | $99,600 | $14,700 | $84,900 |
| 2018 | $409 | $90,400 | $13,600 | $76,800 |
| 2017 | $421 | $91,800 | $13,600 | $78,200 |
| 2016 | $400 | $92,500 | $13,600 | $78,900 |
| 2014 | $416 | $95,000 | $13,600 | $81,400 |
| 2013 | $416 | $95,600 | $13,600 | $82,000 |
Source: Public Records
Map
Nearby Homes
- 10686 N Division Rd
- 6 U S 52
- 5 U S 52
- 11497 N State Road 9
- 11131 N State Road 9
- 256 E 1000 N
- 83 E Walnut St
- 11600 N 100 E
- 1069 W Railroad St
- 5477 S Main St
- 5465 S Greenfield St
- 11546 N Shelby 300 W
- 661 W 500 S
- 5555 S 200 E
- 1898 E 1000 N
- 4500 S 50 W
- 1546 E Osprey Dr
- 0 S 300 East- 2
- 1556 E 400 S
- 1744 E 850 N