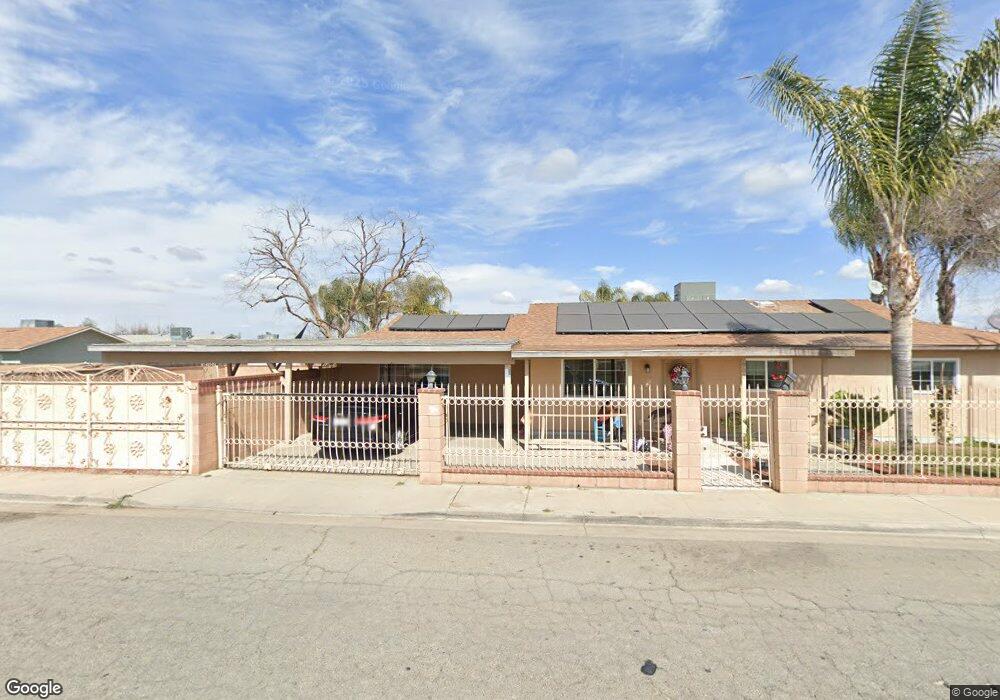
900 W Kern Ave Mc Farland, CA 93250
Estimated Value: $230,000 - $299,000
3
Beds
2
Baths
1,100
Sq Ft
$241/Sq Ft
Est. Value
About This Home
This home is located at 900 W Kern Ave, Mc Farland, CA 93250 and is currently estimated at $264,590, approximately $240 per square foot. 900 W Kern Ave is a home located in Kern County with nearby schools including McFarland High School.
Ownership History
Date
Name
Owned For
Owner Type
Purchase Details
Closed on
Sep 11, 2024
Sold by
Fernandez Amador Ayon
Bought by
Felix Maria Lourdes
Current Estimated Value
Purchase Details
Closed on
Aug 31, 2016
Sold by
Pinedo Maria
Bought by
Felix Maria Lourdes
Purchase Details
Closed on
Dec 29, 2003
Sold by
Pinedo Sergio and Pinedo Maria
Bought by
Pinedo Maria
Purchase Details
Closed on
Mar 14, 1996
Sold by
Household Finance Corp Of California
Bought by
Pinedo Sergio and Pinedo Maria
Home Financials for this Owner
Home Financials are based on the most recent Mortgage that was taken out on this home.
Original Mortgage
$62,934
Interest Rate
7.41%
Mortgage Type
FHA
Purchase Details
Closed on
Dec 4, 1995
Sold by
Salazar Jose I and Salazar Juana A
Bought by
Household Finance Corp
Create a Home Valuation Report for This Property
The Home Valuation Report is an in-depth analysis detailing your home's value as well as a comparison with similar homes in the area
Home Values in the Area
Average Home Value in this Area
Purchase History
| Date | Buyer | Sale Price | Title Company |
|---|---|---|---|
| Felix Maria Lourdes | -- | None Listed On Document | |
| Felix Maria Lourdes | -- | None Available | |
| Pinedo Maria | -- | -- | |
| Pinedo Sergio | $63,500 | First American Title Ins Co | |
| Household Finance Corp | $61,023 | Fidelity National Title Ins |
Source: Public Records
Mortgage History
| Date | Status | Borrower | Loan Amount |
|---|---|---|---|
| Previous Owner | Pinedo Sergio | $62,934 |
Source: Public Records
Tax History Compared to Growth
Tax History
| Year | Tax Paid | Tax Assessment Tax Assessment Total Assessment is a certain percentage of the fair market value that is determined by local assessors to be the total taxable value of land and additions on the property. | Land | Improvement |
|---|---|---|---|---|
| 2025 | $1,300 | $105,459 | $24,902 | $80,557 |
| 2024 | $1,276 | $103,392 | $24,414 | $78,978 |
| 2023 | $1,276 | $101,366 | $23,936 | $77,430 |
| 2022 | $1,241 | $99,379 | $23,467 | $75,912 |
| 2021 | $1,172 | $97,431 | $23,007 | $74,424 |
| 2020 | $1,128 | $96,433 | $22,772 | $73,661 |
| 2019 | $1,064 | $96,433 | $22,772 | $73,661 |
| 2018 | $1,050 | $92,690 | $21,889 | $70,801 |
| 2017 | $1,023 | $90,873 | $21,460 | $69,413 |
| 2016 | $1,008 | $89,092 | $21,040 | $68,052 |
| 2015 | $989 | $87,754 | $20,724 | $67,030 |
| 2014 | $947 | $86,036 | $20,319 | $65,717 |
Source: Public Records
Map
Nearby Homes
- 450 8th St
- 314 8th St
- 539 11th St
- 0 W Sherwood Ave Unit 202506495
- 0 W Sherwood Ave Unit 21453658
- 733 Ensenata Dr
- 124 4th Place
- 249 Robertson Ave
- 737 Misty Ave
- 830 Davis Ave
- 13271 Garzoli Ave
- Floorplan 2000 AP at Tierra Del Sol
- Floorplan 1700 at Tierra Del Sol
- Floorplan 1810 at Tierra Del Sol
- Floorplan 1523 at Tierra Del Sol
- Floorplan 1320 at Tierra Del Sol
- Floorplan 1275 at Tierra Del Sol
- 583 Taylor Ave
- 276 San Juan St
- 254 E Sherwood Ave