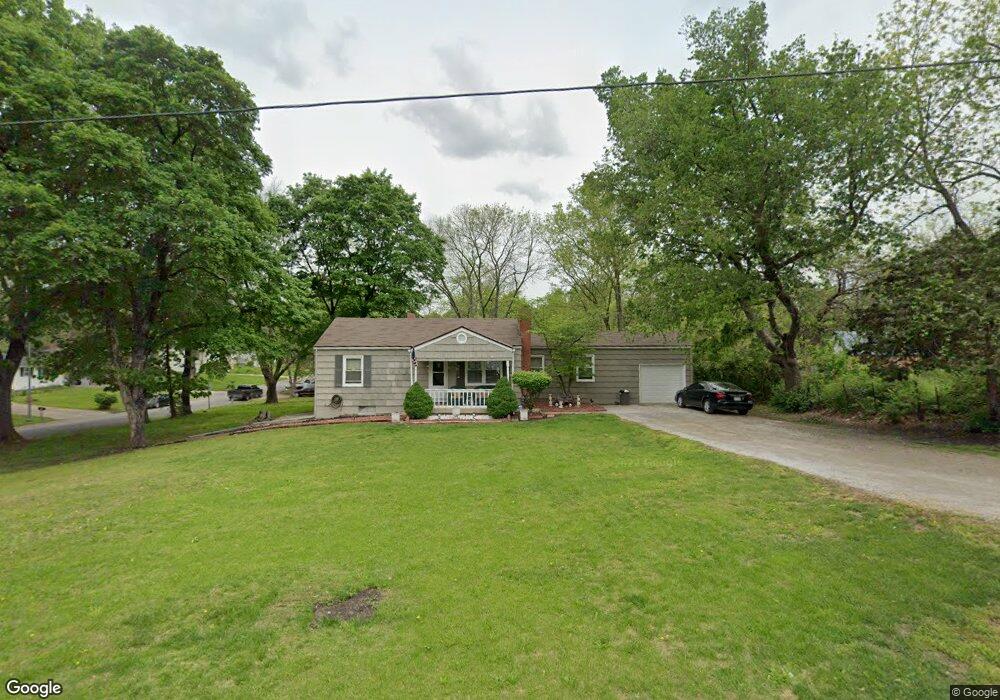
9000 E 92nd St Kansas City, MO 64138
White Oak NeighborhoodEstimated Value: $171,000 - $193,000
3
Beds
2
Baths
922
Sq Ft
$193/Sq Ft
Est. Value
About This Home
This home is located at 9000 E 92nd St, Kansas City, MO 64138 and is currently estimated at $177,875, approximately $192 per square foot. 9000 E 92nd St is a home located in Jackson County with nearby schools including Dobbs Elementary School, St Regis School, and Carver Christian Academy.
Ownership History
Date
Name
Owned For
Owner Type
Purchase Details
Closed on
May 9, 2022
Sold by
C & A Development Inc
Bought by
Ca Developments Inc
Current Estimated Value
Purchase Details
Closed on
Jun 17, 2010
Sold by
Select Portfolio Servicing Inc
Bought by
C & A Developments Inc
Purchase Details
Closed on
Jan 25, 2010
Sold by
Sansone James P and Sansone Stephanie
Bought by
Select Portfolio Servicing Inc and Deutsche Bank National Trust Company
Purchase Details
Closed on
Dec 8, 2006
Sold by
Sansone James P
Bought by
Sansone James P and Sansone Stephanie
Home Financials for this Owner
Home Financials are based on the most recent Mortgage that was taken out on this home.
Original Mortgage
$114,300
Interest Rate
8.25%
Mortgage Type
Stand Alone Refi Refinance Of Original Loan
Purchase Details
Closed on
Aug 25, 2005
Sold by
Calderon Gilma and Calderon Kevin Lund
Bought by
Sansone James P
Home Financials for this Owner
Home Financials are based on the most recent Mortgage that was taken out on this home.
Original Mortgage
$76,000
Interest Rate
6.95%
Mortgage Type
Fannie Mae Freddie Mac
Create a Home Valuation Report for This Property
The Home Valuation Report is an in-depth analysis detailing your home's value as well as a comparison with similar homes in the area
Home Values in the Area
Average Home Value in this Area
Purchase History
| Date | Buyer | Sale Price | Title Company |
|---|---|---|---|
| Ca Developments Inc | -- | None Listed On Document | |
| C & A Developments Inc | -- | Continental Title | |
| Select Portfolio Servicing Inc | -- | None Available | |
| Sansone James P | -- | None Available | |
| Sansone James P | -- | Kansas City Title |
Source: Public Records
Mortgage History
| Date | Status | Borrower | Loan Amount |
|---|---|---|---|
| Previous Owner | Sansone James P | $114,300 | |
| Previous Owner | Sansone James P | $76,000 |
Source: Public Records
Tax History Compared to Growth
Tax History
| Year | Tax Paid | Tax Assessment Tax Assessment Total Assessment is a certain percentage of the fair market value that is determined by local assessors to be the total taxable value of land and additions on the property. | Land | Improvement |
|---|---|---|---|---|
| 2025 | $1,805 | $21,608 | $5,046 | $16,562 |
| 2024 | $1,772 | $20,851 | $5,084 | $15,767 |
| 2023 | $1,772 | $20,851 | $4,739 | $16,112 |
| 2022 | $1,618 | $16,340 | $3,781 | $12,559 |
| 2021 | $1,396 | $16,340 | $3,781 | $12,559 |
| 2020 | $1,467 | $16,233 | $3,781 | $12,452 |
| 2019 | $1,387 | $16,233 | $3,781 | $12,452 |
| 2018 | $845 | $9,229 | $1,933 | $7,296 |
| 2017 | $868 | $9,229 | $1,933 | $7,296 |
| 2016 | $868 | $9,206 | $3,981 | $5,225 |
| 2014 | $841 | $9,025 | $3,902 | $5,123 |
Source: Public Records
Map
Nearby Homes
- 9033 E 90th Terrace
- 9006 Tennessee Ave
- 8916 E 89th Terrace
- 8925 E 89th St
- 9109 E 89th St
- 9218 Mckinley St
- 8602 E 91st Terrace
- 9425 E 90th Terrace
- 9414 Lewis Ave
- 9525 Manning Ave
- 8706 Kentucky Ave
- 8416 E 92nd Place
- 8700 E Bannister Terrace
- 9201 E 87th St
- 8617 Lane Ave
- 9203 Marsh Ave
- 9609 Ditman Way
- 9624 Ditman Way
- 8618 Arlington Ave
- 9525 Wallace Ave
- 9124 Tennessee Ave
- 9119 Tennessee Ave
- 9122 Tennessee Ave
- 9004 E 92nd St
- 9120 Tennessee Ave
- 9001 E 92nd St
- 9115 Tennessee Ave
- 9116 Tennessee Ave
- 9003 E 92nd St
- 9111 Tennessee Ave
- 9110 Tennessee Ave
- 9105 Tennessee Ave
- 8929 E 92nd St
- 9006 E 92nd St
- 9106 Tennessee Ave
- 9007 E 92nd St
- 9103 Tennessee Ave
- 9104 Tennessee Ave
- 8926 E 92nd St
- 9008 E 92nd St