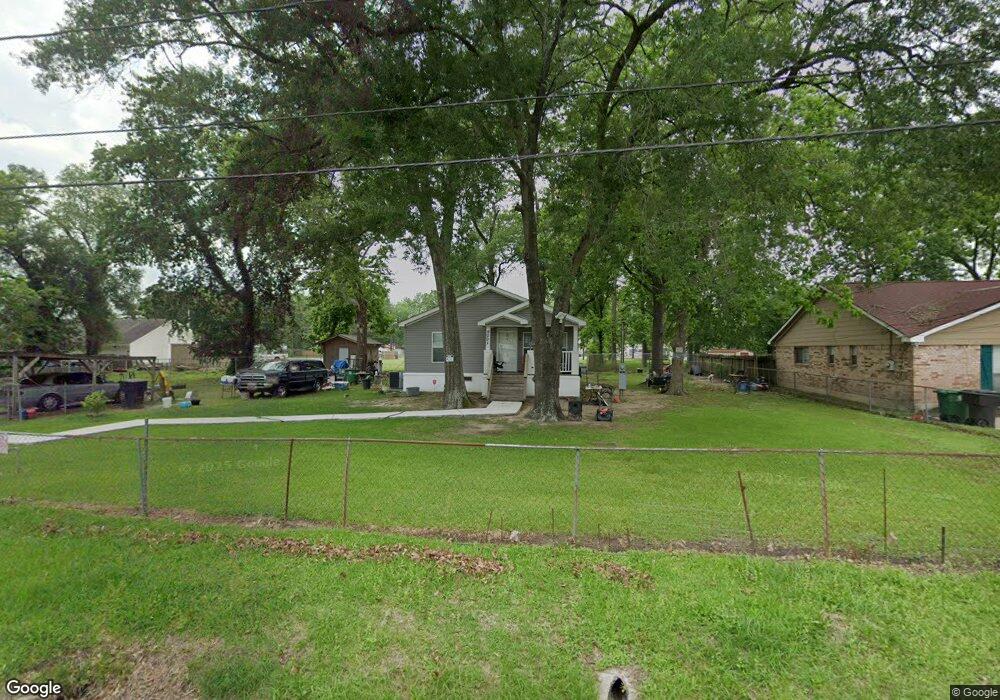
9001 Kelburn Dr Houston, TX 77016
Trinity-Houston Gardens NeighborhoodEstimated Value: $193,000 - $269,560
3
Beds
1
Bath
1,400
Sq Ft
$177/Sq Ft
Est. Value
About This Home
This home is located at 9001 Kelburn Dr, Houston, TX 77016 and is currently estimated at $247,140, approximately $176 per square foot. 9001 Kelburn Dr is a home located in Harris County with nearby schools including Shadydale Elementary School, Forest Brook Middle, and North Forest High School.
Ownership History
Date
Name
Owned For
Owner Type
Purchase Details
Closed on
Sep 12, 2011
Sold by
Broussard Marshall
Bought by
Booker Bonita
Current Estimated Value
Purchase Details
Closed on
Jan 4, 2008
Sold by
Booker Brenda Lavern
Bought by
Broussard Bonita Louise
Home Financials for this Owner
Home Financials are based on the most recent Mortgage that was taken out on this home.
Original Mortgage
$114,207
Interest Rate
6.15%
Mortgage Type
FHA
Purchase Details
Closed on
Aug 8, 2007
Sold by
Booker Brenda Lavern and Goff Marsha Faye Booker
Bought by
Broussard Bonita Louise
Purchase Details
Closed on
Jun 10, 2002
Sold by
Goff Marsha Faye
Bought by
Broussard Bonita Louise
Purchase Details
Closed on
May 7, 2002
Sold by
Booker Emanuel Frederick
Bought by
Broussard Bonita Louise
Create a Home Valuation Report for This Property
The Home Valuation Report is an in-depth analysis detailing your home's value as well as a comparison with similar homes in the area
Home Values in the Area
Average Home Value in this Area
Purchase History
| Date | Buyer | Sale Price | Title Company |
|---|---|---|---|
| Booker Bonita | -- | None Available | |
| Broussard Bonita Louise | -- | Stewart Title Company | |
| Broussard Bonita Louise | -- | None Available | |
| Broussard Bonita Louise | -- | -- | |
| Broussard Bonita Louise | -- | -- |
Source: Public Records
Mortgage History
| Date | Status | Borrower | Loan Amount |
|---|---|---|---|
| Previous Owner | Broussard Bonita Louise | $114,207 |
Source: Public Records
Tax History Compared to Growth
Tax History
| Year | Tax Paid | Tax Assessment Tax Assessment Total Assessment is a certain percentage of the fair market value that is determined by local assessors to be the total taxable value of land and additions on the property. | Land | Improvement |
|---|---|---|---|---|
| 2025 | $1,510 | $299,998 | $100,800 | $199,198 |
| 2024 | $1,510 | $298,240 | $100,800 | $197,440 |
| 2023 | $1,510 | $293,582 | $75,600 | $217,982 |
| 2022 | $2,581 | $221,695 | $50,400 | $171,295 |
| 2021 | $2,484 | $177,781 | $33,600 | $144,181 |
| 2020 | $2,346 | $157,416 | $33,600 | $123,816 |
| 2019 | $2,229 | $140,368 | $26,880 | $113,488 |
| 2018 | $1,327 | $107,820 | $26,880 | $80,940 |
| 2017 | $1,841 | $107,820 | $26,880 | $80,940 |
| 2016 | $1,673 | $86,511 | $21,000 | $65,511 |
| 2015 | $1,064 | $60,157 | $10,626 | $49,531 |
| 2014 | $1,064 | $60,157 | $10,626 | $49,531 |
Source: Public Records
Map
Nearby Homes
- 8928 Homestead Rd
- 9205 & 9207 Spaulding St
- 8914 Lanewood Dr
- 9227 Homestead Rd
- 9316 Sundown Dr
- 6513 Laura Koppe Rd
- 6213 Laura Koppe Rd
- 9317 Homestead Rd
- 6415 Laura Koppe Rd
- 7129 Springdale St Unit A/B
- 9009 Compton St
- 7321 Laura Koppe Rd
- 9313 Sherbourne St
- 7229 Springdale St
- 9412 Crofton St
- 7319 Laura Koppe Rd
- 9318 Sherbourne St
- 9412 Firnat St Unit A-B
- 7410 Glen Manor Dr
- 7423 Sundown3 Dr
- 9009 Kelburn Dr
- 9002 Kelburn Dr
- 9002 Kelburn Dr Unit D
- 9002 Kelburn Dr Unit B
- 9002 Kelburn Dr Unit C
- 9002 Kelburn Dr Unit A
- 9008 Kelburn Dr
- 9101 Kelburn Dr
- 9012 Kelburn Dr
- 9012 Kelburn Dr
- 9105 Pembrook St
- 8930 Kelburn Dr
- 9105 Kelburn Dr
- 9105 Kelburn Dr Unit B
- 9105 Kelburn Dr Unit A
- 9105 Kelburn Dr
- 8925 Kelburn Dr
- 8926 Kelburn Dr
- 0A Fawnridge Dr
- 0B Fawnridge Dr