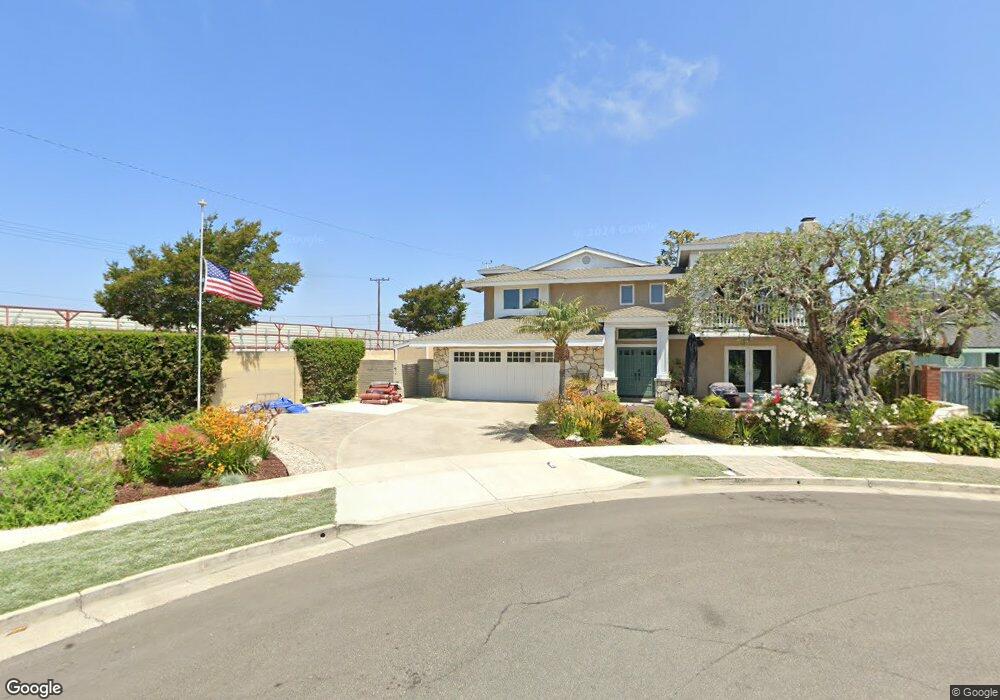
9001 Niguel Cir Huntington Beach, CA 92646
Southeast NeighborhoodEstimated Value: $2,060,000 - $2,304,935
5
Beds
2
Baths
2,300
Sq Ft
$948/Sq Ft
Est. Value
About This Home
This home is located at 9001 Niguel Cir, Huntington Beach, CA 92646 and is currently estimated at $2,180,984, approximately $948 per square foot. 9001 Niguel Cir is a home located in Orange County with nearby schools including John H. Eader Elementary School, Isaac L. Sowers Middle School, and Edison High School.
Ownership History
Date
Name
Owned For
Owner Type
Purchase Details
Closed on
Sep 28, 2020
Sold by
Chase Devin A and Chase Roxane C
Bought by
Chase Devin A and Chase Roxane C
Current Estimated Value
Home Financials for this Owner
Home Financials are based on the most recent Mortgage that was taken out on this home.
Original Mortgage
$353,750
Outstanding Balance
$254,253
Interest Rate
2.9%
Mortgage Type
New Conventional
Estimated Equity
$1,926,731
Purchase Details
Closed on
Jul 15, 2014
Sold by
Chase Roxane Carlos
Bought by
Chase Family Trust
Purchase Details
Closed on
Jun 3, 2014
Sold by
Chase Devin A
Bought by
Chase Roxane Carlos
Purchase Details
Closed on
Dec 27, 2012
Sold by
Chase Devin A and Chase Danna E
Bought by
Chase Devin A
Home Financials for this Owner
Home Financials are based on the most recent Mortgage that was taken out on this home.
Original Mortgage
$417,000
Interest Rate
3.27%
Mortgage Type
New Conventional
Purchase Details
Closed on
Oct 4, 2002
Sold by
Simpson Evelyn M
Bought by
Chase Devin A and Chase Danna E
Home Financials for this Owner
Home Financials are based on the most recent Mortgage that was taken out on this home.
Original Mortgage
$332,900
Interest Rate
6.22%
Create a Home Valuation Report for This Property
The Home Valuation Report is an in-depth analysis detailing your home's value as well as a comparison with similar homes in the area
Home Values in the Area
Average Home Value in this Area
Purchase History
| Date | Buyer | Sale Price | Title Company |
|---|---|---|---|
| Chase Devin A | -- | Title Connect Inc | |
| Chase Devin A | -- | Title Connect Inc | |
| Chase Family Trust | -- | None Available | |
| Chase Roxane Carlos | -- | None Available | |
| Chase Devin A | -- | Lawyers Title | |
| Chase Devin A | $493,000 | Chicago Title Co |
Source: Public Records
Mortgage History
| Date | Status | Borrower | Loan Amount |
|---|---|---|---|
| Open | Chase Devin A | $353,750 | |
| Closed | Chase Devin A | $417,000 | |
| Closed | Chase Devin A | $332,900 |
Source: Public Records
Tax History Compared to Growth
Tax History
| Year | Tax Paid | Tax Assessment Tax Assessment Total Assessment is a certain percentage of the fair market value that is determined by local assessors to be the total taxable value of land and additions on the property. | Land | Improvement |
|---|---|---|---|---|
| 2025 | $11,469 | $1,031,922 | $559,586 | $472,336 |
| 2024 | $11,469 | $1,011,689 | $548,614 | $463,075 |
| 2023 | $11,213 | $991,852 | $537,856 | $453,996 |
| 2022 | $10,919 | $972,404 | $527,309 | $445,095 |
| 2021 | $10,715 | $953,338 | $516,970 | $436,368 |
| 2020 | $10,645 | $943,563 | $511,669 | $431,894 |
| 2019 | $10,516 | $925,062 | $501,636 | $423,426 |
| 2018 | $10,215 | $894,573 | $491,800 | $402,773 |
| 2017 | $7,108 | $611,395 | $482,157 | $129,238 |
| 2016 | $6,820 | $601,941 | $472,703 | $129,238 |
| 2015 | $6,754 | $592,900 | $465,603 | $127,297 |
| 2014 | $6,611 | $581,286 | $456,482 | $124,804 |
Source: Public Records
Map
Nearby Homes
- 9021 Niguel Cir
- 21621 Kaneohe Ln
- 9171 Regatta Dr
- 9101 Aloha Dr
- 21211 Poston Ln
- 9112 Playa Dr
- 21221 Hillsdale Ln
- 9411 Daytona Cir
- 21722 Hilaria Cir
- 21292 Bulkhead Cir
- 21941 Oceanview Ln
- 9221 Belcaro Dr
- 21131 Greenboro Ln
- 9581 Chevy Chase Dr
- 21851 Newland St Unit 7
- 21851 Newland St Unit 279
- 21851 Newland St Unit 58
- 21851 Newland St Unit 8
- 21851 Newland St Unit 45
- 21851 Newland St Unit 255
- 9002 Bobbie Cir
- 9022 Bobbie Cir
- 9031 Niguel Cir
- 9002 Niguel Cir
- 9032 Bobbie Cir
- 9022 Niguel Cir
- 9041 Niguel Cir
- 9032 Niguel Cir
- 9042 Bobbie Cir
- 9042 Niguel Cir
- 9061 Niguel Cir
- 9001 Adelia Cir
- 9001 Bobbie Cir
- 9021 Adelia Cir
- 9021 Bobbie Cir
- 9062 Bobbie Cir
- 9031 Bobbie Cir
- 9031 Adelia Cir
- 9062 Niguel Cir
- 9071 Niguel Cir