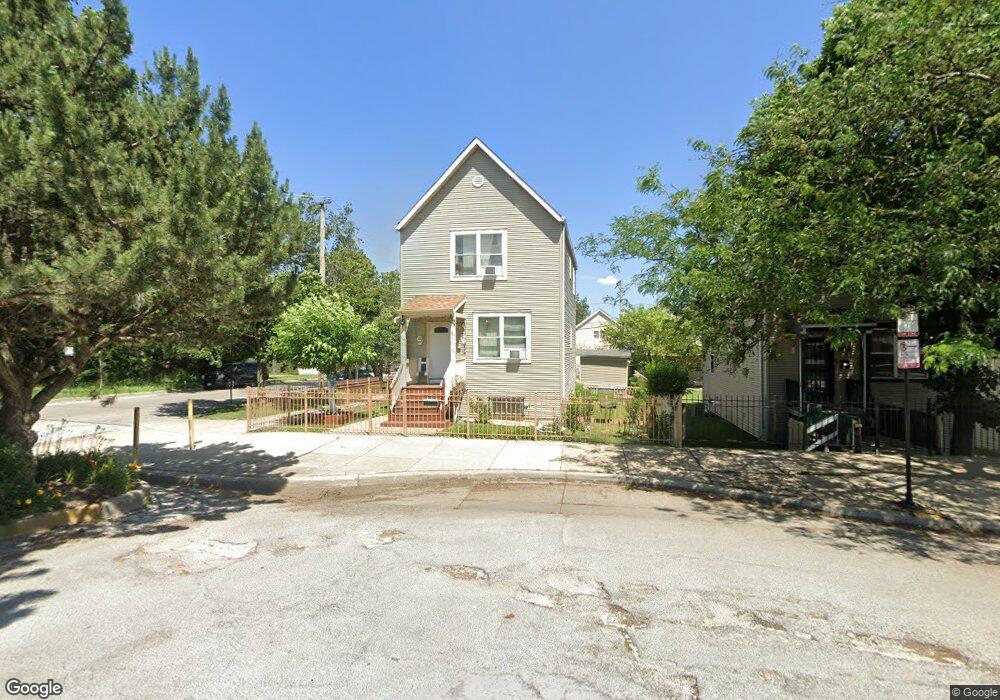
9001 S Brandon Ave Chicago, IL 60617
South Chicago NeighborhoodEstimated Value: $130,000 - $210,000
3
Beds
2
Baths
1,349
Sq Ft
$125/Sq Ft
Est. Value
About This Home
This home is located at 9001 S Brandon Ave, Chicago, IL 60617 and is currently estimated at $168,985, approximately $125 per square foot. 9001 S Brandon Ave is a home located in Cook County with nearby schools including Thorp J N Elementary School, LEARN South Chicago, and Our Lady Of Guadalupe School.
Ownership History
Date
Name
Owned For
Owner Type
Purchase Details
Closed on
Feb 23, 2011
Sold by
Federal Home Loan Mortgage Corporation
Bought by
Lopez Rosa M and Canchola Jaime
Current Estimated Value
Purchase Details
Closed on
Oct 29, 2010
Sold by
Charles Alice R
Bought by
Federal Home Loan Mortgage Corp
Purchase Details
Closed on
Mar 6, 2000
Sold by
New Homes For South Chicago Joint Ventur
Bought by
Charles Alice R
Home Financials for this Owner
Home Financials are based on the most recent Mortgage that was taken out on this home.
Original Mortgage
$73,000
Interest Rate
8.3%
Purchase Details
Closed on
Jan 29, 1999
Sold by
City Of Chicago
Bought by
New Homes For South Chicago Joint Ventur
Purchase Details
Closed on
Feb 5, 1997
Sold by
Claretian Associates Inc
Bought by
New Homes For South Chicago Joint Ventur
Create a Home Valuation Report for This Property
The Home Valuation Report is an in-depth analysis detailing your home's value as well as a comparison with similar homes in the area
Home Values in the Area
Average Home Value in this Area
Purchase History
| Date | Buyer | Sale Price | Title Company |
|---|---|---|---|
| Lopez Rosa M | $16,000 | None Available | |
| Federal Home Loan Mortgage Corp | -- | None Available | |
| Charles Alice R | $91,000 | -- | |
| New Homes For South Chicago Joint Ventur | -- | -- | |
| New Homes For South Chicago Joint Ventur | -- | -- | |
| Claretian Associates Inc | -- | -- |
Source: Public Records
Mortgage History
| Date | Status | Borrower | Loan Amount |
|---|---|---|---|
| Previous Owner | Charles Alice R | $73,000 | |
| Closed | Charles Alice R | $18,969 |
Source: Public Records
Tax History Compared to Growth
Tax History
| Year | Tax Paid | Tax Assessment Tax Assessment Total Assessment is a certain percentage of the fair market value that is determined by local assessors to be the total taxable value of land and additions on the property. | Land | Improvement |
|---|---|---|---|---|
| 2024 | $1,363 | $13,300 | $3,910 | $9,390 |
| 2023 | $1,308 | $9,759 | $5,213 | $4,546 |
| 2022 | $1,308 | $9,759 | $5,213 | $4,546 |
| 2021 | $1,296 | $9,759 | $5,213 | $4,546 |
| 2020 | $2,171 | $12,822 | $3,388 | $9,434 |
| 2019 | $2,211 | $14,407 | $3,388 | $11,019 |
| 2018 | $2,173 | $14,407 | $3,388 | $11,019 |
| 2017 | $2,910 | $16,862 | $3,127 | $13,735 |
| 2016 | $2,884 | $16,862 | $3,127 | $13,735 |
| 2015 | $2,616 | $16,862 | $3,127 | $13,735 |
| 2014 | $2,094 | $13,828 | $2,606 | $11,222 |
| 2013 | $2,042 | $13,828 | $2,606 | $11,222 |
Source: Public Records
Map
Nearby Homes
- 9018 S Brandon Ave
- 8942 S Baltimore Ave
- 3258 E 91st St Unit 3D
- 8937 S Houston Ave
- 9036 S Houston Ave
- 8909 S Houston Ave
- 8847 S Burley Ave
- 9121 S Mackinaw Ave
- 9034 S Commercial Ave
- 9021 S Exchange Ave
- 8732 S Buffalo Ave
- 8825 S Exchange Ave
- 8834 S Exchange Ave
- 8830 S Exchange Ave
- 8822 S Exchange Ave
- 9335 S Chicago Ave
- 8750 S Exchange Ave
- 2841 E 89th St
- 9116 S South Chicago Ave
- 8711 S Exchange Ave
- 9005 S Brandon Ave
- 9009 S Brandon Ave
- 9011 S Brandon Ave
- 9011 S Brandon Ave Unit 2
- 9011 S Brandon Ave Unit 3
- 9011 S Brandon Ave Unit 1
- 9011 S Brandon Ave
- 9015 S Brandon Ave
- 9015 S Brandon Ave
- 9017 S Brandon Ave
- 9006 S Burley Ave
- 3218 E 90th St
- 3216 E 90th St
- 9008 S Burley Ave
- 9000 S Burley Ave
- 9010 S Burley Ave
- 8949 S Brandon Ave
- 8949 S Brandon Ave
- 9000 S Brandon Ave
- 9023 S Brandon Ave