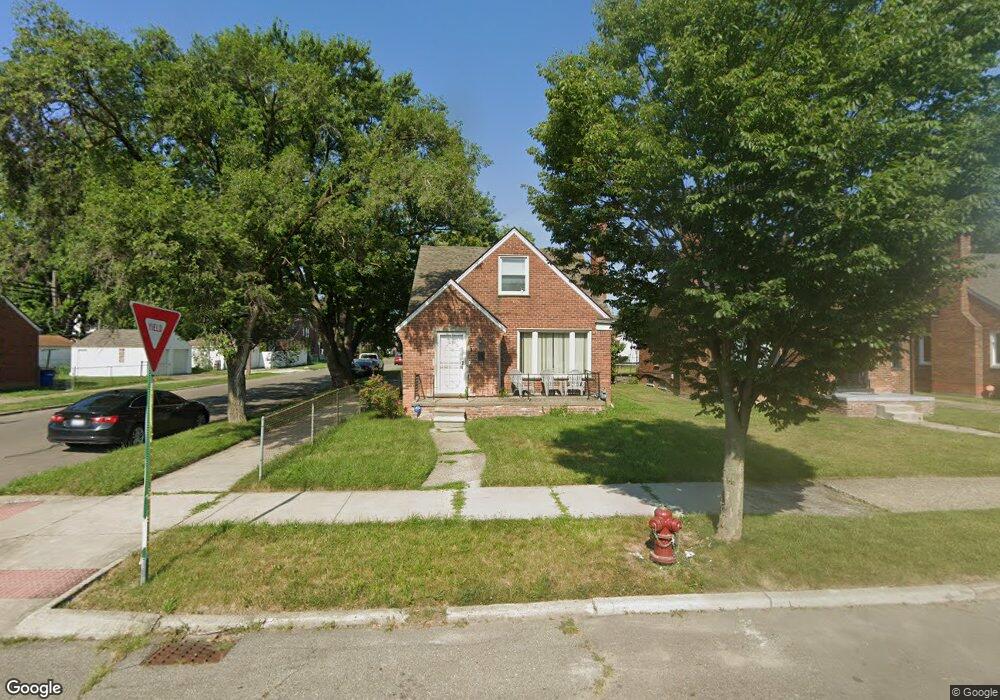
9001 Warwick St Detroit, MI 48228
Franklin Park NeighborhoodEstimated Value: $88,000 - $113,000
--
Bed
1
Bath
1,182
Sq Ft
$82/Sq Ft
Est. Value
About This Home
This home is located at 9001 Warwick St, Detroit, MI 48228 and is currently estimated at $97,304, approximately $82 per square foot. 9001 Warwick St is a home located in Wayne County with nearby schools including Bates Academy, Charles L. Spain Elementary-Middle School, and Edward 'Duke' Ellington Conservatory of Music and Art.
Ownership History
Date
Name
Owned For
Owner Type
Purchase Details
Closed on
Nov 15, 2021
Sold by
Thomas Elaine
Bought by
Thomas Elaine J and Thomas Tino K
Current Estimated Value
Purchase Details
Closed on
Oct 29, 2021
Sold by
Douglas J C
Bought by
Thomas Elaine
Purchase Details
Closed on
Nov 30, 2007
Sold by
Innovative Property Solutions Inc
Bought by
Jc Douglas Llc and Tobrik Llc
Purchase Details
Closed on
Jan 3, 2007
Sold by
Fazekas Stephanie
Bought by
Us Bank Na
Purchase Details
Closed on
Aug 22, 2005
Sold by
Martin Quinnon
Bought by
Fazekas Stephanie
Purchase Details
Closed on
Aug 31, 2004
Sold by
Hoggatt Guymon E
Bought by
Martin Quinnon
Home Financials for this Owner
Home Financials are based on the most recent Mortgage that was taken out on this home.
Original Mortgage
$80,000
Interest Rate
7.12%
Mortgage Type
Purchase Money Mortgage
Create a Home Valuation Report for This Property
The Home Valuation Report is an in-depth analysis detailing your home's value as well as a comparison with similar homes in the area
Home Values in the Area
Average Home Value in this Area
Purchase History
| Date | Buyer | Sale Price | Title Company |
|---|---|---|---|
| Thomas Elaine J | -- | None Available | |
| Thomas Elaine | $27,000 | None Available | |
| Jc Douglas Llc | $28,000 | General Title Agency W Inc | |
| Us Bank Na | $80,750 | None Available | |
| Fazekas Stephanie | $112,000 | Minnesota Title Agency | |
| Martin Quinnon | $100,000 | Liberty Title Insurance Agen |
Source: Public Records
Mortgage History
| Date | Status | Borrower | Loan Amount |
|---|---|---|---|
| Previous Owner | Martin Quinnon | $80,000 |
Source: Public Records
Tax History Compared to Growth
Tax History
| Year | Tax Paid | Tax Assessment Tax Assessment Total Assessment is a certain percentage of the fair market value that is determined by local assessors to be the total taxable value of land and additions on the property. | Land | Improvement |
|---|---|---|---|---|
| 2025 | $1,273 | $46,400 | $0 | $0 |
| 2024 | $1,273 | $39,000 | $0 | $0 |
| 2023 | $1,234 | $31,300 | $0 | $0 |
| 2022 | $1,352 | $25,500 | $0 | $0 |
| 2021 | $1,518 | $21,300 | $0 | $0 |
| 2020 | $1,304 | $18,100 | $0 | $0 |
| 2019 | $1,284 | $16,400 | $0 | $0 |
| 2018 | $1,093 | $15,100 | $0 | $0 |
| 2017 | $269 | $14,200 | $0 | $0 |
| 2016 | $1,309 | $17,800 | $0 | $0 |
| 2015 | $1,780 | $17,800 | $0 | $0 |
| 2013 | $2,103 | $25,005 | $0 | $0 |
| 2010 | -- | $35,827 | $1,082 | $34,745 |
Source: Public Records
Map
Nearby Homes
- 9042 Piedmont St
- 8882 Warwick St
- 9083 Grandville Ave
- 9221 Grandville Ave
- 8686 Artesian St
- 8626 Piedmont St
- 9034 Brace St
- 8651 Brace St
- 8508 Artesian St
- 9357 Piedmont St
- 8618 Minock St
- 9256 Auburn St
- 8610 Auburn St
- 8427 Piedmont St
- 8889 Plainview Ave
- 8656 Plainview Ave
- 8878 Evergreen Ave
- 8909 Penrod St
- 18918 W Chicago St
- 9528 Westwood St
- 9011 Warwick St
- 9000 Piedmont St
- 9010 Piedmont St
- 8907 Warwick St
- 8906 Piedmont St
- 9018 Piedmont St
- 9019 Warwick St
- 8901 Warwick St
- 8900 Piedmont St
- 9028 Piedmont St
- 9027 Warwick St
- 9035 Warwick St
- 8890 Piedmont St
- 8891 Warwick St
- 9034 Piedmont St
- 8883 Warwick St
- 8882 Piedmont St
- 9045 Warwick St
- 8874 Piedmont St
- 8875 Warwick St