9003 Colby Ct Inver Grove Heights, MN 55076
Estimated Value: $466,632 - $499,000
3
Beds
3
Baths
2,921
Sq Ft
$165/Sq Ft
Est. Value
About This Home
This home is located at 9003 Colby Ct, Inver Grove Heights, MN 55076 and is currently estimated at $482,908, approximately $165 per square foot. 9003 Colby Ct is a home located in Dakota County with nearby schools including Pine Bend Elementary School, Inver Grove Heights Middle School, and Simley Senior High School.
Ownership History
Date
Name
Owned For
Owner Type
Purchase Details
Closed on
Sep 6, 2019
Sold by
Williams George A and Williams Jean M
Bought by
Christiansen Jeffrey B and Christiansen Kristin K
Current Estimated Value
Home Financials for this Owner
Home Financials are based on the most recent Mortgage that was taken out on this home.
Original Mortgage
$289,900
Outstanding Balance
$223,584
Interest Rate
3.6%
Mortgage Type
New Conventional
Estimated Equity
$259,324
Purchase Details
Closed on
Jan 12, 2017
Sold by
Kemp Julie T
Bought by
Williams Jean M and Williams George A
Purchase Details
Closed on
Jun 24, 2010
Sold by
Gregg Donna K
Bought by
Kemp Julie T
Purchase Details
Closed on
Feb 23, 2007
Sold by
Baton Homes Inc
Bought by
Gregg Donna K
Purchase Details
Closed on
Oct 21, 2004
Sold by
Rauschnot Frank J and Rauschnot Nancy C
Bought by
Baton Homes Inc
Create a Home Valuation Report for This Property
The Home Valuation Report is an in-depth analysis detailing your home's value as well as a comparison with similar homes in the area
Home Values in the Area
Average Home Value in this Area
Purchase History
| Date | Buyer | Sale Price | Title Company |
|---|---|---|---|
| Christiansen Jeffrey B | $409,900 | Legacy Title | |
| Williams Jean M | $395,000 | Bankers Title | |
| Kemp Julie T | $294,000 | -- | |
| Gregg Donna K | $412,680 | -- | |
| Baton Homes Inc | $135,000 | -- |
Source: Public Records
Mortgage History
| Date | Status | Borrower | Loan Amount |
|---|---|---|---|
| Open | Christiansen Jeffrey B | $289,900 |
Source: Public Records
Tax History Compared to Growth
Tax History
| Year | Tax Paid | Tax Assessment Tax Assessment Total Assessment is a certain percentage of the fair market value that is determined by local assessors to be the total taxable value of land and additions on the property. | Land | Improvement |
|---|---|---|---|---|
| 2024 | $4,514 | $405,700 | $106,300 | $299,400 |
| 2023 | $4,514 | $404,800 | $107,000 | $297,800 |
| 2022 | $3,758 | $387,100 | $106,800 | $280,300 |
| 2021 | $3,944 | $342,700 | $92,900 | $249,800 |
| 2020 | $3,892 | $352,300 | $88,500 | $263,800 |
| 2019 | $4,147 | $346,900 | $84,300 | $262,600 |
| 2018 | $3,852 | $344,000 | $78,000 | $266,000 |
| 2017 | $3,422 | $319,400 | $72,200 | $247,200 |
| 2016 | $3,329 | $280,500 | $68,800 | $211,700 |
| 2015 | $3,579 | $258,913 | $62,417 | $196,496 |
| 2014 | -- | $261,202 | $57,430 | $203,772 |
| 2013 | -- | $239,838 | $52,459 | $187,379 |
Source: Public Records
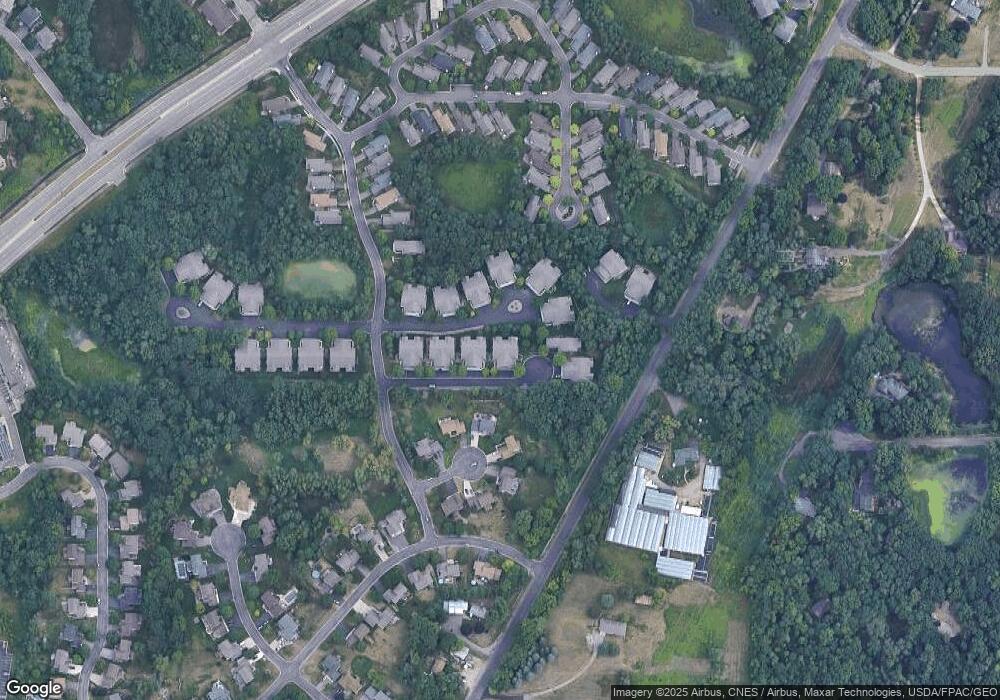
Map
Nearby Homes
- 8827 Coffman Path
- 3853 90th St E
- TBd Cahill Blvd Blvd
- 8770 Benson Way Unit 82
- 8590 Corcoran Path
- 8550 Corcoran Path
- 8355 Cooper Way
- 8336 Cloman Ave
- 8904 Brunswick Path Unit 2104
- 8816 Brunell Way Unit 404
- 8361 Carew Ct
- 8381 Corcoran Cir Unit 49
- 9649-9665 Cedarwood Ct
- 8124 Clifford Cir
- 8789 Branson Dr Unit 72
- 3750 80th St E
- 8104 Dana Path
- 8086 Dana Path
- 7996 Corey Path
- 7949 Cooper Ave E
- 9001 Colby Ct
- 9005 Colby Ct
- 8999 Colby Ct
- 8997 Colby Ct
- 8962 Coffman Path
- 8964 Coffman Path
- 8960 Coffman Path
- 9019 Coffman Cir
- 8993 Colby Ct
- 8958 Coffman Path
- 8966 Coffman Path
- 8974 Coffman Path
- 8976 Coffman Path
- 9007 Colby Ct
- 9011 Colby Ct
- 8972 Coffman Path
- 8997 Coffman Cir
- 8968 Coffman Path
- 8956 Coffman Path
- 9009 Colby Ct